
| [ < ] | [ > ] | [ << ] | [ Up ] | [ >> ] | [Top] | [Contents] | [Index] | [ ? ] |
MathGL library supports the simplest scripts for data handling and plotting. These scripts can be used independently (with the help of UDAV, mgl2png, mgl2eps, mgl2svg programs and others, see section Utilities for parsing MGL) or in the frame of the library using.
| [ < ] | [ > ] | [ << ] | [ Up ] | [ >> ] | [Top] | [Contents] | [Index] | [ ? ] |
MGL script language is rather simple. Each string is a command. First word of string is the name of command. Other words are command arguments. Command may have up to 1000 arguments (at least for now). Words are separated from each other by space or tabulation symbol. The upper or lower case of words is sufficient, i.e. variables a and A are different variables. Symbol ‘#’ starts the comment (all characters after # will be ignored). The exception is situation when ‘#’ is a part of some string. Also options can be specified after symbol ‘;’ (see section Command options). Symbol ‘:’ starts new command (like new line character) if it is not placed inside a string or inside brackets.
If string contain references to external parameters (substrings ‘$0’, ‘$1’ ... ‘$9’) or definitions (substrings ‘$a’, ‘$b’ ... ‘$z’) then before execution the values of parameter/definition will be substituted instead of reference. It allows to use the same MGL script for different parameters (filenames, paths, condition and so on).
Argument can be a string, a variable name or a number.
a(1) or a(1,:) or a(1,:,:) is second row, a(:,2) or a(:,2,:) is third column, a(:,:,0) is first slice and so on. Also you can extract a part of array from m-th to n-th element by code a(m:n,:,:) or just a(m:n).
a('n*w^2/exp(t)') if names for data columns was specified (by idset command or in the file at string started with ##).
tmp[i,j] = sqrt(dat[i,5,j]+1).
Temporary variables can not be used as 1st argument for commands which create (return) the data (like ‘new’, ‘read’, ‘hist’ and so on).
nan=#QNAN, pi=3.1415926..., on=1, off=0, :=-1 are treated as number if they were not redefined by user. Variables with suffixes are treated as numbers (see section Suffixes for variable). Names defined by define command are treated as number. Also results of formulas with sizes 1x1x1 are treated as number (for example, ‘pi/dat.nx’).
Before the first using all variables must be defined with the help of commands, like, new, var, list, copy, read, hist, sum and so on (see section Data create and Make another data).
Command may have several set of possible arguments (for example, plot ydat and plot xdat ydat). All command arguments for a selected set must be specified. However, some arguments can have default values. These argument are printed in [], like plot ydat ['stl'='' zval=nan]. At this, the record [arg1 arg2 arg3 ...] means [arg1 [arg2 [arg3 ...]]], i.e. you can omit only tailing arguments if you agree with its default values. For example, plot ydat '' 1 or plot ydat '' is correct, but plot ydat 1 is incorrect (argument 'stl' is missed).
All MGL commands can be divided on several groups. I will use the following notation for a command description: command names are bold, strings are denoted by commas, variable names are italic, numbers are typewriter. Optional arguments are placed in square brackets and default values for them are shown. Detailed description of color, line styles (see section Line styles), color schemes (see section Color scheme), font types, TeX-like symbols (see section Font styles) and formulas (see section Textual formulas) can be found in corresponding section.
| [ < ] | [ > ] | [ << ] | [ Up ] | [ >> ] | [Top] | [Contents] | [Index] | [ ? ] |
The set of MathGL features is rather rich – just the number of basic graphics types is larger than 40. Also there are functions for data handling, plot setup and so on. In spite of it I tried to keep a similar style in command names and in the order of arguments. Mostly it is used for different drawing functions.
There are 4 most general (base) concepts:
In addition to the general concepts I want to comment on some non-trivial or less commonly used general ideas – plot positioning, axis specification and curvilinear coordinates, styles for lines, text and color scheme.
| 1.2.1 Coordinate axes | ||
| 1.2.2 Line styles | ||
| 1.2.3 Color scheme | ||
| 1.2.4 Font styles | ||
| 1.2.5 Textual formulas |
| [ < ] | [ > ] | [ << ] | [ Up ] | [ >> ] | [Top] | [Contents] | [Index] | [ ? ] |
Two axis representations are used in MathGL. The first one consists of normalizing the data point coordinates in a box MinxMax (see section Axis settings). If Cut is true then the outlier points are omitted, otherwise they are projected to the bounding box (see section Cutting). Also, the point will be omitted if it lies inside the box defined by CutMin x CutMax or if the value of formula CutOff() is nonzero for its coordinates. After that, transformation formulas are applied to the data point. Finally, the data point is plotted by one of the functions.
There is a possibility to set members Max, Min directly, but one should call RecalcBorder() function to setup plotting routines. A safer way is to set these values by calling the Axis() function, which calls RecalcBorder() automatically. Another way to specify the scaling of the axis is to set it as a minimal or maximal value of the data array. Functions XRange(), YRange(), ZRange() do it. The second (optional) argument is used to replace the axis range or to join with the existed range.
The axis origin is defined by the variable Org and is applied to all consequent calls of axes or grid drawing. By default, if this point lies outside the bounding box then it is projected onto the one (variable AutoOrg controls it). If one of the values of Org is equal to NAN then the corresponding value will be selected automatically.
There is 4-th axis c (color axis or colorbar) in addition to the usual axes x, y, z. It sets the range of values for the surface coloring. Its borders are automatically set to values of Min.z, Max.z during the call of Axis() function. Also, one can directly change the color range by setting variables Cmax, Cmax, or calling functions CAxis() or CRange(). Use Colorbar() function for showing the colorbar.
The form (appearence) of tick labels is controlled by SetTicks() function (see section Axis settings). It has 3 arguments: first one d sets the tick step (if positive) or tick number (if negative) or switches logarithmic ticks on (if zero); the second one, ns, sets the number of subticks; the last one is the starting point for ticks (default is axis origin). Function SetTuneTicks switches on/off tick enhancing by factoring out acommon multiplier (for small coordinate values, like 0.001 to 0.002, or large, like from 1000 to 2000) or common component (for narrow range, like from 0.999 to 1.000). Finally, you may use functions SetXTT(), SetYTT(), SetZTT(), SetCTT() for setting templates for tick labels (it supports TeX symbols). Also, there is a possibility to print arbitrary text as tick labels the by help of SetTicksVal() function.
| [ < ] | [ > ] | [ << ] | [ Up ] | [ >> ] | [Top] | [Contents] | [Index] | [ ? ] |
The line style is defined by the string which may contain specifications for color (‘wkrgbcymhRGBCYMHWlenupqLENUPQ’), dashing style (‘-|;:ji’ or space), width (‘0123456789’) and marks (‘o+xsd.^v’ and ‘#’ modifier). If one of the type of information is omitted then default values used with the previous color or one from palette (for see section 1D plotting) are adopted. By default palette contain following colors: dark gray ‘H’, blue ‘b’, green ‘g’, red ‘r’, cyan ‘c’, magenta ‘m’, yellow ‘y’, gray ‘h’, green-blue ‘l’, sky-blue ‘n’, orange ‘q’, green-yellow ‘e’, blue-violet ‘u’, purple ‘p’.
The color types are: ‘k’ -- black, ‘r’ -- red, ‘R’ -- dark red, ‘g’ -- green, ‘G’ -- dark green, ‘b’ -- blue, ‘B’ -- dark blue, ‘c’ -- cyan, ‘C’ -- dark cyan, ‘m’ -- magenta, ‘M’ -- dark magenta, ‘y’ -- yellow, ‘Y’ -- dark yellow (gold), ‘h’ -- gray, ‘H’ -- dark gray, ‘w’ -- white, ‘W’ -- bright gray, ‘l’ -- green-blue, ‘L’ -- dark green-blue, ‘e’ -- green-yellow, ‘E’ -- dark green-yellow, ‘n’ -- sky-blue, ‘N’ -- dark sky-blue, ‘u’ -- blue-violet, ‘U’ -- dark blue-violet, ‘p’ -- purple, ‘P’ -- dark purple, ‘q’ -- orange, ‘Q’ -- dark orange (brown).
Dashing style has the following meaning: space -- no line (usable for plotting only marks), ‘-’ -- solid line (■■■■■■■■■■■■■■■■), ‘|’ -- long dashed line (■■■■■■■■□□□□□□□□), ‘;’ -- dashed line (■■■■□□□□■■■■□□□□), ‘=’ -- small dashed line (■■□□■■□□■■□□■■□□), ‘:’ -- dotted line (■□□□■□□□■□□□■□□□), ‘j’ -- dash-dotted line (■■■■■■■□□□□■□□□□), ‘i’ -- small dash-dotted line (■■■□□■□□■■■□□■□□).Marker types are: ‘o’ – circle, ‘+’ – cross, ‘x’ – skew cross, ‘s’ - square, ‘d’ - rhomb (or diamond), ‘.’ – dot (point), ‘^’ – triangle up, ‘v’ – triangle down, ‘<’ – triangle left, ‘>’ – triangle right, ‘#*’ – Y sign, ‘#+’ – squared cross, ‘#x’ – squared skew cross, ‘#.’ – circled dot. If string contain symbol ‘#’ then the solid versions of markers are used.
Styles of lines and marks.
One may specify to draw a special symbol (an arrow) at the beginning and at the end of line. This is done if the specification string contains one of the following symbols: ‘A’ – outer arrow, ‘V’ – inner arrow, ‘I’ – transverse hatches, ‘K’ – arrow with hatches, ‘T’ – triangle, ‘S’ – square, ‘D’ – rhombus, ‘O’ – circle, ‘_’ – nothing (the default). The following rule applies: the first symbol specifies the arrow at the end of line, the second specifies the arrow at the beginning of the line. For example, ‘r-A’ defines a red solid line with usual arrow at the end, ‘b|AI’ defines a blue dash line with an arrow at the end and with hatches at the beginning, ‘_O’ defines a line with the current style and with a circle at the beginning. These styles are applicable during the graphics plotting as well (for example, 1D plotting).
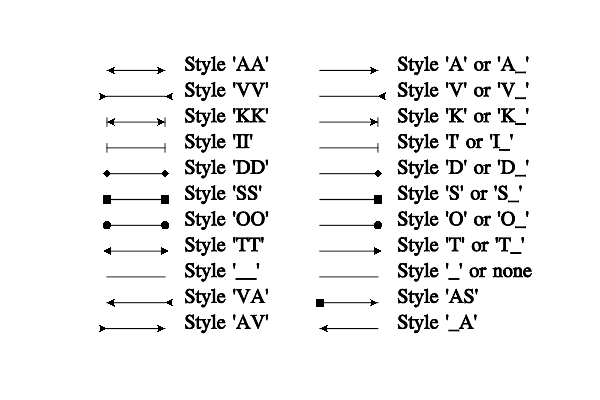
Arrow styles.
| [ < ] | [ > ] | [ << ] | [ Up ] | [ >> ] | [Top] | [Contents] | [Index] | [ ? ] |
The color scheme is used for determining the color of surfaces, isolines, isosurfaces and so on. The color scheme is defined by the string, which may contain several characters that are color id (see section Line styles) or characters ‘d#:|’. Symbol ‘d’ denotes the interpolation by 3d position instead of the coloring by amplitude. Symbol ‘#’ switches to mesh drawing or to a wire plot. Symbol ‘|’ disables color interpolation in color scheme, which can be useful, for example, for sharp colors during matrix plotting. Symbol ‘:’ finishes the color scheme parsing. Following it, the user may put styles for the text, rotation axis for curves/isocontours, and so on. Color scheme may contain up to 32 color values.
You may also use “lighted” colors in the color scheme specification (not in line style!). The “lighted” color contain 2 symbols: first one is the usual symbol for color specification, the second one is a digit for its brightness. The digit can be in range ‘1’...‘9’. Number ‘5’ corresponds to a normal color, ‘1’ is a very dark version of the color (practically black), and ‘9’ is a very bright version of the color (practically white). For example, the color scheme can be ‘b2b7wr7r2’.
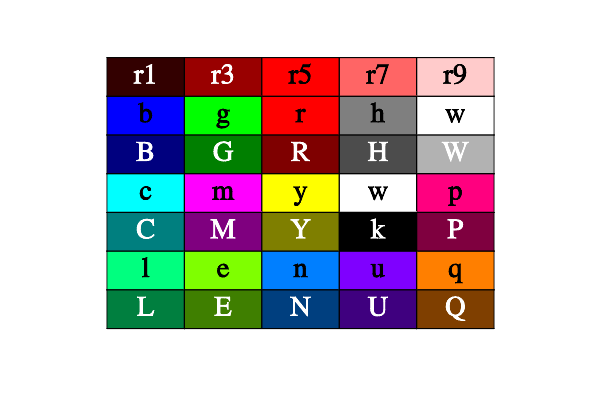
Colors and its ids.
For coloring by amplitude (most common) the final color is a linear interpolation of color array. The color array is constructed from the string ids. The argument is the amplitude normalized between Cmin – Cmax (see section Axis settings). For example, string containing 4 characters ‘bcyr’ corresponds to a colorbar from blue (lowest value) through cyan (next value) through yellow (next value) to the red (highest value). String ‘kw’ corresponds to a colorbar from black (lowest value) to white (highest value). String ‘m’ corresponds to a simple magenta color.
There are several useful combinations. String ‘kw’ corresponds to the simplest gray color scheme where higher values are brighter. String ‘wk’ presents the inverse gray color scheme where higher value is darker. Strings ‘kRryw’, ‘kGgw’, ‘kBbcw’ present the well-known hot, summer and winter color schemes. Strings ‘BbwrR’ and ‘bBkRr’ allow to view bi-color figure on white or black background, where negative values are blue and positive values are red. String ‘BbcyrR’ gives a color scheme similar to the well-known jet color scheme.
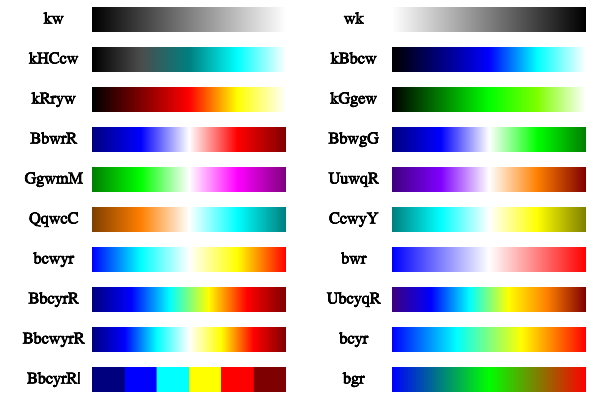
Most popular color schemes.
When coloring by coordinate, the final color is determined by the position of the point in 3d space and is calculated from formula c=x*c[1] + y*c[2] + z*c[3]. Here, c[1], c[2], c[3] are the first three elements of color array; x, y, z are normalized to Min – Max coordinates of the point. This type of coloring is useful for isosurface plot where color may show the exact position of a piece of surface.
| [ < ] | [ > ] | [ << ] | [ Up ] | [ >> ] | [Top] | [Contents] | [Index] | [ ? ] |
Text style is specified by the string which may contain several characters of font (‘ribwou’) and/or alignment (‘LRC’) specifications. The string also may contain the color id characters ‘wkrgbcymhRGBCYMHW’ (see section Line styles) after the symbol ‘:’. For example, ‘biC:b’ sets the bold italic font text aligned at the center and with blue color.
The font types are: ‘r’ – roman font, ‘i’ – italic style, ‘b’ – bold style. By default roman roman font is used. The align types are: ‘L’ – align left (default), ‘C’ – align center, ‘R’ – align right. Additional font effects are: ‘w’ – wired, ‘o’ – over-lined, ‘u’ – underlined.
Also a parsing of the LaTeX-like syntax is provided. There are commands for the font style changing inside the string (for example, use \b for bold font): \a or \overline – over-lined, \b or \textbf – bold, \i or \textit – italic, \r or \textrm – roman (disable bold and italic attributes), \u or \underline – underlined, \w or \wire – wired, \big – bigger size, @ – smaller size. The lower and upper indexes are specified by ‘_’ and ‘^’ symbols. At this the changed font style is applied only on next symbol or symbols in braces {}. The text in braces {} are treated as single symbol that allow one to print the index of index. For example, compare the strings ‘sin (x^{2^3})’ and ‘sin (x^2^3)’. You may also change text color inside string by command #? or by \color? where ‘?’ is symbolic id of the color (see section Line styles). For example, words ‘Blue’ and ‘red’ will be colored in the string ‘#b{Blue} and \colorr{red} text’. The most of functions understand the newline symbol ‘\n’ and allows to print multi-line text. Finally, you can use arbitrary UTF codes by command \utf0x????. For example, \utf0x3b1 will produce
α symbol.
The most of commands for special TeX or AMSTeX symbols, the commands for font style changing (\textrm, \textbf, \textit, \textsc, \overline, \underline), accents (\hat, \tilde, \dot, \ddot, \acute, \check, \grave, \bar, \breve) and roots (\sqrt, \sqrt3, \sqrt4) are recognized. The full list contain approximately 2000 commands. Note that first space symbol after the command is ignored, but second one is printed as normal symbol (space). For example, the following strings produce the same result \tilde a: ‘\tilde{a}’; ‘\tilde a’; ‘\tilde{}a’.
In particular, the Greek letters are recognizable special symbols: α – \alpha, β – \beta, γ – \gamma, δ – \delta, ε – \epsilon, η – \eta, ι – \iota, χ – \chi, κ – \kappa, λ – \lambda, μ – \mu, ν – \nu, o – \o, ω – \omega, ϕ – \phi, π – \pi, ψ – \psi, ρ – \rho, σ – \sigma, θ – \theta, τ – \tau, υ – \upsilon, ξ – \xi, ζ – \zeta, ς – \varsigma, ɛ – \varepsilon, ϑ – \vartheta, φ – \varphi, ϰ – \varkappa; A – \Alpha, B – \Beta, Γ – \Gamma, Δ – \Delta, E – \Epsilon, H – \Eta, I – \Iota, C – \Chi, K – \Kappa, Λ – \Lambda, M – \Mu, N – \Nu, O – \O, Ω – \Omega, Φ – \Phi, Π – \Pi, Ψ – \Psi, R – \Rho, Σ – \Sigma, Θ – \Theta, T – \Tau, Υ – \Upsilon, Ξ – \Xi, Z – \Zeta.The small part of most common special TeX symbols are: ∠ – \angle, ⋅ – \cdot, ♣ – \clubsuit, ✓ – \checkmark, ∪ – \cup, ∩ – \cap, ♢ – \diamondsuit, ◇ – \diamond, ÷ – \div, ↓ – \downarrow, † – \dag, ‡ – \ddag, ≡ – \equiv, ∃ – \exists, ⌢ – \frown, ♭ – \flat, ≥ – \ge, ≥ – \geq, ≧ – \geqq, ← – \gets, ♡ – \heartsuit, ∞ – \infty, ∫ – \int, \Int, ℑ – \Im, ♢ – \lozenge, ⟨ – \langle, ≤ – \le, ≤ – \leq, ≦ – \leqq, ← – \leftarrow, ∓ – \mp, ∇ – \nabla, ≠ – \ne, ≠ – \neq, ♮ – \natural, ∮ – \oint, ⊙ – \odot, ⊕ – \oplus, ∂ – \partial, ∥ – \parallel, ⊥ –\perp, ± – \pm, ∝ – \propto, ∏ – \prod, ℜ – \Re, → – \rightarrow, ⟩ – \rangle, ♠ – \spadesuit, ~ – \sim, ⌣ – \smile, ⊂ – \subset, ⊃ – \supset, √ – \sqrt or \surd, § – \S, ♯ – \sharp, ∑ – \sum, × – \times, → – \to, ∴ – \therefore, ↑ – \uparrow, ℘ – \wp.
The font size can be defined explicitly (if size>0) or relative to a base font size as |size|*FontSize (if size<0). The value size=0 specifies that the string will not be printed. The base font size is measured in internal “MathGL” units. Special functions SetFontSizePT(), SetFontSizeCM(), SetFontSizeIN() allow one to set it in more “common” variables for a given dpi value of the picture.
| [ < ] | [ > ] | [ << ] | [ Up ] | [ >> ] | [Top] | [Contents] | [Index] | [ ? ] |
MathGL have the fast variant of textual formula evaluation . There are a lot of functions and operators available. The operators are: ‘+’ – addition, ‘-’ – subtraction, ‘*’ – multiplication, ‘/’ – division, ‘^’ – integer power. Also there are logical “operators”: ‘<’ – true if x<y, ‘>’ – true if x>y, ‘=’ – true if x=y, ‘&’ – true if x and y both nonzero, ‘|’ – true if x or y nonzero. These logical operators have lowest priority and return 1 if true or 0 if false.
The basic functions are: ‘sqrt(x)’ – square root of x, ‘pow(x,y)’ – power x in y, ‘ln(x)’ – natural logarithm of x, ‘lg(x)’ – decimal logarithm of x, ‘log(a,x)’ – logarithm base a of x, ‘abs(x)’ – absolute value of x, ‘sign(x)’ – sign of x, ‘mod(x,y)’ – x modulo y, ‘step(x)’ – step function, ‘int(x)’ – integer part of x, ‘rnd’ – random number, ‘pi’ – number π = 3.1415926…
Trigonometric functions are: ‘sin(x)’, ‘cos(x)’, ‘tan(x)’ (or ‘tg(x)’). Inverse trigonometric functions are: ‘asin(x)’, ‘acos(x)’, ‘atan(x)’. Hyperbolic functions are: ‘sinh(x)’ (or ‘sh(x)’), ‘cosh(x)’ (or ‘ch(x)’), ‘tanh(x)’ (or ‘th(x)’). Inverse hyperbolic functions are: ‘asinh(x)’, ‘acosh(x)’, ‘atanh(x)’.
There are a set of special functions: ‘gamma(x)’ – Gamma function Γ(x) = ∫0∞ tx-1 exp(-t) dt, ‘psi(x)’ – digamma function ψ(x) = Γ′(x)/Γ(x) for x≠0, ‘ai(x)’ – Airy function Ai(x), ‘bi(x)’ – Airy function Bi(x), ‘cl(x)’ – Clausen function, ‘li2(x)’ (or ‘dilog(x)’) – dilogarithm Li2(x) = -ℜ∫0xds log(1-s)/s, ‘sinc(x)’ – compute sinc(x) = sin(πx)/(πx) for any value of x, ‘zeta(x)’ – Riemann zeta function ζ(s) = ∑k=1∞k-s for arbitrary s≠1, ‘eta(x)’ – eta function η(s) = (1 - 21-s)ζ(s) for arbitrary s, ‘lp(l,x)’ – Legendre polynomial Pl(x), (|x|≤1, l≥0), ‘w0(x)’ – principal branch of the Lambert W function, ‘w1(x)’ – principal branch of the Lambert W function. Function W(x) is defined to be solution of the equation: W exp(W) = x.
The exponent integrals are: ‘ci(x)’ – Cosine integral Ci(x) = ∫0xdt cos(t)/t, ‘si(x)’ – Sine integral Si(x) = ∫0xdt sin(t)/t, ‘erf(x)’ – error function erf(x) = (2/√π) ∫0xdt exp(-t2) , ‘ei(x)’ – exponential integral Ei(x) = -PV(∫-x∞dt exp(-t)/t) (where PV denotes the principal value of the integral), ‘e1(x)’ – exponential integral E1(x) = ℜ∫1∞dt exp(-xt)/t, ‘e2(x)’ – exponential integral E2(x) = ℜ∫1∞dt exp(-xt)/t2, ‘ei3(x)’ – exponential integral Ei3(x) = ∫0xdt exp(-t3) for x≥0.
Bessel functions are: ‘j(nu,x)’ – regular cylindrical Bessel function of fractional order nu, ‘y(nu,x)’ – irregular cylindrical Bessel function of fractional order nu, ‘i(nu,x)’ – regular modified Bessel function of fractional order nu, ‘k(nu,x)’ – irregular modified Bessel function of fractional order nu.
Elliptic integrals are: ‘ee(k)’ – complete elliptic integral is denoted by E(k) = E(π/2,k), ‘ek(k)’ – complete elliptic integral is denoted by K(k) = F(π/2,k), ‘e(phi,k)’ – elliptic integral E(φ,k) = ∫0φdt √(1 - k2sin2(t)), ‘f(phi,k)’ – elliptic integral F(φ,k) = ∫0φdt 1/√(1 - k2sin2(t))
Jacobi elliptic functions are: ‘sn(u,m)’, ‘cn(u,m)’, ‘dn(u,m)’, ‘sc(u,m)’, ‘sd(u,m)’, ‘ns(u,m)’, ‘cs(u,m)’, ‘cd(u,m)’, ‘nc(u,m)’, ‘ds(u,m)’, ‘dc(u,m)’, ‘nd(u,m)’.
Note, some of these functions are unavailable if NO_GSL is defined during compilation of MathGL library.
There is no difference between lower or upper case in formulas. If argument value lie outside the range of function definition then function returns NaN.
| [ < ] | [ > ] | [ << ] | [ Up ] | [ >> ] | [Top] | [Contents] | [Index] | [ ? ] |
Coomands in this group influences on overall graphics appearance. So all of them should be placed before any actual plotting commands.
| 1.3.1 Transparency | ||
| 1.3.2 Lighting | ||
| 1.3.3 Fog | ||
| 1.3.4 Default sizes | ||
| 1.3.5 Zooming | ||
| 1.3.6 Cutting | ||
| 1.3.7 Other settings |
| [ < ] | [ > ] | [ << ] | [ Up ] | [ >> ] | [Top] | [Contents] | [Index] | [ ? ] |
There are several commands for setup transparency. The general command is alpha which switch on/off the transparency for overall plot. It influence only for graphics which created after alpha call. Command alphadef specify the default value of alpha-channel. You may switch off transparency of selected plot by command transparent. Finally, command transptype set the kind of transparency. See section Transparent surface sample, for sample code and picture.
[val=on]Sets the transparency on/off. It is recommended to call this command before any plotting command. Default value is off. Use transparent off in particular plot to disable its transparency.
valDefault value of alpha channel (transparency) for all plotting commands. Initial value is 0.5.
valTemporary switches transparency on/off for the plot.
valThis command set the transparency type. Normal transparency (‘0’) – below things is less visible than upper ones. Glass-like transparency (‘1’) – below and upper things are commutable and just decrease intensity of light by RGB channel. Lamp-like transparency (‘2’) – below and upper things are commutable and are the source of some additional light. I recommend to set alphadef 0.3 or less for lamp-like transparency. See section Normal transparency, Glass-like transparency, Lamp-like transparency.
| [ < ] | [ > ] | [ << ] | [ Up ] | [ >> ] | [Top] | [Contents] | [Index] | [ ? ] |
There are several commands for setup lighting. The general command is light which switch on/off the lighting for overall plot. Generally MathGL support up to 10 independent light sources. The position, color, brightness of each light source can be set separately. By default only one light source is active. It is source number 0 with white color, located at top of the plot.
[val=on]Sets the using of light on/off for overall plot. It is recommended to call this command before any plotting command. Default value is lightning off.
num valSwitch on/off num-th light source separately.
num xpos ypos zpos ['col'='w' br=0.5]The command adds a light source with identification num at position {xpos, ypos, zpos}. The color of light is col (white by default). The brightness of light is br which must be in range [0,1].
valSets the brightness of ambient light. The value should be in range [0,1]. Initial value is 0.5.
| [ < ] | [ > ] | [ << ] | [ Up ] | [ >> ] | [Top] | [Contents] | [Index] | [ ? ] |
val [dz=0.25]Command imitate a fog in the plot. Fog start from relative distance dz from view point and its density growths exponentially in depth. So that the fog influence is determined by law ~1-exp(-d*z). Here z is normalized to 1 depth of the plot. If value val=0 then the fog is absent. See section Surface in fog sample, for sample code and picture.
| [ < ] | [ > ] | [ << ] | [ Up ] | [ >> ] | [Top] | [Contents] | [Index] | [ ? ] |
These commands control the default (initial) values for most graphics parameters including sizes of markers, arrows, linewidth and so on. As any other settings these ones will influence only on plots created after the settings change.
valSets relative width of rectangles in bars, barh, boxplot. Default value is 0.7.
valThe size of marks. Default value is 1.
valThe size of arrows for lines and curves. Default value is 1.
valThe variable define the base width for all lines. The value <1 is ignored. Increase of this variables is actual for large bitmap pictures. Default value is 1.
val [stt=1]The relative length of axis ticks. Default value is 0.1. Parameter stt>0 set relative length of subticks which is in sqrt(1+stt) times smaller.
The line style of axis ticks (stl) and subticks (sub). If stl=” then default style is used (‘k’ or ‘w’ depending on transparency type). If sub=” then ticks style is used (i.e. stl).
| [ < ] | [ > ] | [ << ] | [ Up ] | [ >> ] | [Top] | [Contents] | [Index] | [ ? ] |
These commands control the overall zooming of the picture or the sub-picture. Normally you can use these variables and commands for removing “white” spaces around a plot.
valThe factor of plot size. It is not recommended to set it lower then 1.6. This is some analogue of command zoom but applied not to overall image but for each inplot. Use negative value to enable automatic plotfactor selection.
x1 y1 x2 y2The command changes the scale of graphics that correspond to zoom in/out of the picture. After command call the current plot will be cleared and further the picture will contain plotting from its part [x1,x2]*[y1,y2]. Here picture coordinates x1, x2, y1, y2 changes from 0 to 1. Use zoom 0 0 1 1 to return default view.
| [ < ] | [ > ] | [ << ] | [ Up ] | [ >> ] | [Top] | [Contents] | [Index] | [ ? ] |
These commands set the condition when the points are excluded (cutted) from the drawing. Note, that a point with nan value(s) of coordinate or amplitude will be automatically excluded from the drawing.
valDetermines how points outside bounding box are drawn. If it is on then points are excluded from plot (it is default) otherwise the points are projected to edges of bounding box.
x1 y1 z1 x2 y2 z2Lower and upper edge of the box in which never points are drawn. If both edges are the same (the variables are equal) then the cutting box is empty. See section CutMinMax sample, for sample code and picture.
Command set the cutting off condition by formula cond. This condition determine will point be plotted or not. If value of formula is nonzero then point is omitted, otherwise it plotted. Set argument as '' to disable cutting off condition. See section CutOff sample, for sample code and picture.
| [ < ] | [ > ] | [ << ] | [ Up ] | [ >> ] | [Top] | [Contents] | [Index] | [ ? ] |
val=6]Font style for text and labels (see text). Initial style is ’fnt’=’rC’ give Roman font with centering. Parameter val sets the size of font for tick and axis labels. Default font size of axis labels is 1.4 times large than for tick labels. For more detail, see section Font styles.
valSet to use or not text rotation along axis. Initial value is on.
Set the palette as selected colors. Default value is 'Hbgrcmyhlnqeup'. The palette is used mostly in 1D plots for curves which styles are not specified.
numSets approximate number of lines in mesh, fall, grid and also the number of hachures in vect, vectc, dew and the number of cells in cloud. By default (=0) it draws all lines/hachures/cells.
Set direction around which curve rotated in axial, torus. Default value is ’z’.
| [ < ] | [ > ] | [ << ] | [ Up ] | [ >> ] | [Top] | [Contents] | [Index] | [ ? ] |
These large set of commands control how the axis and ticks will be drawn. Note that there is 3-step transformation of data coordinates are performed. Firstly, coordinates are projected and cutting is applied (see section Cutting), after it transformation formulas are applied, and finally the data was normalized in bounding box.
x1 y1 x2 y2x1 y1 z1 x2 y2 z2x1 x2 y1 y2 [z1=0 z2=0]Sets the ranges of coordinates changing. Also it sets the range for coloring (analogous to caxis z1 z2). Initial ranges are [-1, 1].
Sets the transformation formulas for curvilinear coordinates. Each string should contain mathematical expression for real coordinate depending on internal coordinates ‘x’, ‘y’, ‘z’ and ‘a’ or ‘c’ for colorbar. For example, the cylindrical coordinates are introduced as axis 'x*cos(y)' 'x*sin(y)' 'z'. For removing of formulas the corresponding parameter should be ''. The using of transformation formulas will slightly slowing the program, i.e. axis '' '' '' is faster than axis '1*x' '1*y' '1*z'. Initially all formulas are absent (Cartesian coordinates are used). For more details about functions and formulas, see section Textual formulas.
howSets one of the predefined transformation formulas for curvilinear coordinate. Paramater how define the coordinates: ‘0’ – Cartesian coordinates (no transformation); ‘1’ – Polar coordiantes x_n=x*cos(y),y_n=x*sin(y), z_n=z; ‘2’ – Spherical coordinates x_n=x*sin(y)*cos(z), y_n=x*sin(y)*sin(z), z_n=x*cos(y); ‘3’ – Parabolic coordinates x_n=x*y, y_n=(x*x-y*y)/2, z_n=z; ‘4’ – Paraboloidal coordinates x_n=(x*x-y*y)*cos(z)/2, y_n=(x*x-y*y)*sin(z)/2, z_n=x*y; ‘5’ – Oblate coordinates x_n=cosh(x)*cos(y)*cos(z), y_n=cosh(x)*cos(y)*sin(z), z_n=sinh(x)*sin(y); ‘6’ – Prolate coordinates x_n=sinh(x)*sin(y)*cos(z), y_n=sinh(x)*sin(y)*sin(z), z_n=cosh(x)*cos(y); ‘7’ – Elliptic coordinates x_n=cosh(x)*cos(y), y_n=sinh(x)*sin(y), z_n=z; ‘8’ – Toroidal coordinates x_n=sinh(x)*cos(z)/(cosh(x)-cos(y)), y_n=sinh(x)*sin(z)/(cosh(x)-cos(y)), z_n=sin(y)/(cosh(x)-cos(y)); ‘9’ – Bispherical coordinates x_n=sin(y)*cos(z)/(cosh(x)-cos(y)), y_n=sin(y)*sin(z)/(cosh(x)-cos(y)), z_n=sinh(x)/(cosh(x)-cos(y)); ‘10’ – Bipolar coordinates x_n=sinh(x)/(cosh(x)-cos(y)), y_n=sin(y)/(cosh(x)-cos(y)), z_n=z.
z1 z2Sets the range for surface coloring. Initial range is [-1, 1].
x0 y0 [z0=nan]Center of axis cross section. If one of values is nan then MathGL library try to select optimal axis position.
valThe command sets to draws Ternary plot. This special plot is for 3 dependent coordinates (components) a, b, c so that a+b+c=1. MathGL uses only 2 independent coordinates a=x and b=y since it is enough to plot everything. At this third coordinate z act as another parameter to produce contour lines, surfaces and so on. See section Ternary plot sample, for sample code and picture.
add=off fact=0]add=off fact=0]add=off fact=0]add=off fact=0]Sets the range for x-,y-,z- coordinate or coloring as minimal and maximal values of data dat. Parameter add=on shows that the new range will be joined to existed one (nut will not replace it). Parameter fact add additional range increase on value (Max-Min)*fact.
x1 x2x1 x2x1 x2x1 x2Sets the range for x-,y-,z- coordinate or coloring. See also axis.
val [sub=0 org=nan]val [sub=0 org=nan]val [sub=0 org=nan]valSets step for x-, y-, z-axis ticks or colorbar ticks (if val>0) or it’s number (if val<0) in corresponding direction. Zero value val=0 sets logarithmic ticks. Parameter sub sets the number of sub-ticks. Parameter org set the starting points for ticks. If not org=nan then the value from origin is used.
Sets the template for x-, y-, z-axis ticks or colorbar ticks. It may contain TeX symbols also. If templ='' then default template is used (in simplest case it is ‘%.2g’) with automatic detaching of common multiplier or common component.
val1 'lbl1' [val2 'lbl2' ...]val1 'lbl1' [val2 'lbl2' ...]val1 'lbl1' [val2 'lbl2' ...]Sets manual positions val1,val2,... and labels lbl1,lbl2,... for ticks along x-, y-, z-axis. Labels may contain TeX symbols also.
Set the ticks step, number of sub-ticks and initial ticks position to be the most human readable for the axis along direction(s) dir.
| [ < ] | [ > ] | [ << ] | [ Up ] | [ >> ] | [Top] | [Contents] | [Index] | [ ? ] |
These commands control how and where further plotting will be placed. There is a curtain order of calling of these commands for the better plot view. First one should be subplot or inplot for specifying the place. After it a rotate and aspect. And finally any other plotting commands may be called. Alternatevely you can use columnplot for position plots in the column one by another without gap between plot axis (bounding boxes).
nx ny m [dx=0 dy=0]Puts further plotting in a m-th cell of nx*ny grid of the whole frame area. This command set off any aspects or rotations. So it should be used first for creating the subplot. From the aesthetical point of view it is not recommended to use this command with different matrices in the same frame. The position of the cell can be shifted from its default position by relative size dx, dy.
nx ny m 'style'The same as previous but space reserved for axis/colorbar is saved only if style contain: ‘L’ or ‘<’ – at left side, ‘R’ or ‘>’ – at right side, ‘A’ or ‘^’ – at top side, ‘U’ or ‘_’ – at bottom side.
x1 x2 y1 y2 [rel=off]Puts further plotting in some region of the whole frame surface. This command allows one to create a plot in arbitrary place of the screen. The position is defined by rectangular coordinates [x1, x2]*[y1, y2]. The coordinates x1, x2, y1, y2 are normalized to interval [0, 1]. If parameter rel=on then the relative position to current subplot is used. This command set off any aspects or rotations. So it should be used first for creating subplot.
num ind [d=0]Puts further plotting in ind-th cell of column with num cells. The position is relative to previous subplot call (or inplot with rel=off). Parameter d set extra gap between cells.
num ind tet phiPuts further plotting in ind-th cell of stick with num cells. At this, stick is rotated on angles tet, phi. The position is relative to previous subplot call (or inplot with rel=off).
tetz tetx [tety=0]Rotates a further plotting relative to each axis (x, z, y) consecutively on angles tetx, tetz, tety.
tet x y zRotates a further plotting around vector {x,y,z} on angle tet.
ax ay [az=1]Defines aspect ratio for the plot. The viewable axes will be related one to another as the ratio ax:ay:az. For the best effect it should be used after rotate command.
valAdd (switch on) the perspective to plot. The parameter val ~ 1/z_eff \in [0,1). By default (val=0) the perspective is off.
| [ < ] | [ > ] | [ << ] | [ Up ] | [ >> ] | [Top] | [Contents] | [Index] | [ ? ] |
solid=off]Exports current picture/frame to file ’fname’ (file type is determined by extension). Solid (usually white) background will be used if solid=on. If ’fname’=” then the file ‘frameNNNN.jpg’ is used, where ‘NNNN’ is current frame id.
w hSets size of picture in pixels. This function call must be placed before any plotting command because it completely remove picture content. In some program the call of this function is forbidden.
| [ < ] | [ > ] | [ << ] | [ Up ] | [ >> ] | [Top] | [Contents] | [Index] | [ ? ] |
These commands draw some simple objects like line, point, sphere, drop, cone and so on.
Clear the picture by removes all drawing from it. Does not change transformation matrix.
x y ['col'='r']x y z ['col'='r']Draws a point (ball) at position {x, y, z} with color defined by string col.
x1 y1 x2 y2 ['stl'='']x1 y1 z1 x2 y2 z2 ['stl'='']Draws a geodesic line (straight line in Cartesian coordinates) from point {x1,y1,z1} to {x2,y2,z2} using line style stl.
x1 y1 dx1 dy1 x2 y2 dx2 dy2 ['stl'='']x1 y1 z1 dx1 dy1 dz1 x2 y2 z2 dx2 dy2 dz2 ['stl'='']Draws Bezier-like curve from point {x1,y1,z1} to {x2,y2,z2} using line style stl. At this tangent is co-directed with {dx1,dy1,dz1}, {dx2,dy2,dz2} and proportional to its amplitude.
x0 y0 z0 wy wz ['stl'='' d1=0 d2=0]x0 y0 z0 wx wz ['stl'='' d1=0 d2=0]x0 y0 z0 wx wy ['stl'='' d1=0 d2=0]Draws the solid rectangle (face) perpendicular to [x,y,z]-axis correspondingly at position {x0, y0, z0} with color stl and with widths wx, wy, wz along corresponding directions. At this colors can be the same for all vertexes or different if all 4 colors are specified for each vertex. Parameters d1!=0, d2!=0 set additional shift of the last vertex (i.e. to draw quadrangle).
x0 y0 r ['col'='r']x0 y0 z0 r ['col'='r']Draw the sphere with radius r and center at point {x0, y0, z0} and color stl.
x0 y0 dx dy r ['col'='b' sh=1 asp=1]x0 y0 z0 dx dy dz r ['col'='b' sh=1 asp=1]Draw the drop with radius r at point {x0,y0,z0} elongated in direction {dx,dy,dz} and with color col. Parameter sh set the degree of drop oblongness: ‘0’ is sphere, ‘1’ is maximally oblongness drop. Parameter asp set relative width of the drop (this is analogue of “ellipticity” for the sphere). See section Drops sample, for sample code and picture.
x1 y1 z1 x2 y2 z2 r1 [r2=-1 'stl'='' edge=off]Draw tube (or truncated cone if edge=off) between points {x1,y1,z1}, {x2,y2,z2} with radiuses at the edges r1, r2. If r2<0 then it is supposed that r2=r1. The cone color is defined by string stl.
x1 y1 x2 y2 ['st'='']x1 y1 z1 x2 y2 z2 ['st'='']Draw rectangle from point {x1,y1,z1} to point {x2,y2,z2} using colors stl. If stl have 4 or more colors then it defines colors for each rectangle vertex (useful for making gradients, like ‘wwrr’) else first color is used for whole rectangle.
| [ < ] | [ > ] | [ << ] | [ Up ] | [ >> ] | [Top] | [Contents] | [Index] | [ ? ] |
These commands draw the text. There are commands for drawing text in arbitrary place, in arbitrary direction and along arbitrary curve. It is possible to use arbitrary font-faces and parse many TeX commands. The Unicode text is supported. So sometimes you need to specify locale. The size argument control the size of text: if positive it give the value, if negative it give the value relative to defined by font command. See section Font styles.
x y 'text' ['fnt'='' size=-1.4]x y z 'text' ['fnt'='' size=-1.4]Draws unrotated text string text at position {x,y,z} with specified style fnt and size. By default parameters from font command are used.
x y dx dy 'text' [size=-1.4]x y z dx dy dz 'text' [size=-1.4]The command plots the string text at position {x,y,z} along direction {dx,dy,dz} with specified style fnt and size. By default parameters from font command are used.
size=-1 zval=nan]size=-1 zval=nan]size=-1]The command draws text along the curve between points {xdat[i], ydat[i], zdat[i]} by font style fnt and with size size. The string fnt may contain symbols ‘t’ for printing the text under the curve (default), or ‘T’ for printing the text above the curve. The sizes of 1st dimension must be equal for all arrays xdat.nx=ydat.nx=zdat.nx. If array xdat is not specified then its an automatic array is used with values equidistantly distributed along x. If array zdat is not specified then z[i] = zval is used. See section Text sample, for sample code and picture.
size=-2]Print string text as title of the picture (at the top of the picture). Can be used at any place (even inside subplot).
x y 'fname' [n=0 'fnt'='' size=-1.4]x y z 'fname' [n=0 'fnt'='' size=-1.4]Draws unrotated n-th line of file fname at position {x,y,z} with specified size. By default parameters from font command are used.
| [ < ] | [ > ] | [ << ] | [ Up ] | [ >> ] | [Top] | [Contents] | [Index] | [ ? ] |
These commands draw the “things for measuring”, like axis with ticks, colorbar with ticks, grid along axis, bounding box and labels for axis. For more information see section Axis settings.
adjust=off]Draws axes with ticks (see section Axis settings) in directions determined by string parameter dir.If string contain the symbol ‘_’ then tick labels are not printed. Font for ticks labels is determined by command font. Ticks will be automatically adjusted if adjust=on (by call of adjust 'dir').
pos=0]Draws colorbar with color scheme sch (current scheme if sch='') at edge of plot. Parameter pos specifies the position of colorbar: ‘0’ - at right (default), ‘1’ - at left, ‘2’ - at top, ‘3’ - at bottom. If string sch contains ‘<>^_’ then the parameter pos is defined as: pos=0 for ‘>’ (right), pos=1 for ‘<’ (left), pos=2 for ‘^’ (top), pos=3 for ‘_’ (bottom). If string have ‘A’ then absolute (relative to picture) coordinates is used. See section Dens sample, for sample code and picture.
pos=0]The same as previous but with sharp colors sch (current palette if sch="") for values v. See section ContD sample, for sample code and picture.
pos x y w hThe same as first one but at arbitrary position of subplot {x, y} (supposed to be in range [0,1]). Parameters w, h set the relative width and height of the colorbar.
Draws grid lines perpendicular to direction determined by string parameter dir. The step of grid lines is the same as tick step for an axis. The style of lines is determined by pen parameter.
ticks=on]Draws bounding box outside the plotting volume with line style ’stl’. If ticks=on then ticks are drawn with current axis setting.
pos=0 size=-1.4 shift=0]pos=0 size=-1.4 shift=0]pos=0 size=-1.4 shift=0]pos=0 size=-1.4 shift=0]Prints the label text for x-,y-,z-,t-axis (here ‘t’ is “ternary” axis t=1-x-y). The position of label is determined by pos parameter. If pos=0 then label is printed at the center of axis. If pos>0 then label is printed at the maximum of axis (default). If pos<0 then label is printed at the minimum of axis. The font size is 1.4 times larger than the one for ticks font. Parameter shift specify additional shifting of the label. See section Text printing.
| [ < ] | [ > ] | [ << ] | [ Up ] | [ >> ] | [Top] | [Contents] | [Index] | [ ? ] |
These commands draw legend to the graph (useful for 1D plotting). Legend entry is a pair of strings: one for style of the line, another one with description text (with included LaTeX parsing). The array of string are accumulated first to the internal arrays (by command addlegend) and are plotted later. The position of the legend can be selected automatic or manually. Parameters fnt and size specify the font style and size. Parameter llen set the relative width of the line sample and the text indent (default value is 0.1). If line style string for entry is empty then the corresponding text is printed without indent. If string contains ‘A’ then legend coordinates set position in the picture. See section Legend sample, for sample code and picture.
pos=3 'fnt'='rL' size=-1 llen=0.1]Draws legend of accumulated legend entries by font fnt with specified size. Parameter pos sets the position of the legend: ‘0’ is bottom left corner, ‘1’ is bottom right corner, ‘2’ is top left corner, ‘3’ is top right corner (is default).
x y ['fnt'='rL' size=-1 llen=0.1]Draws legend of accumulated legend entries by font fnt with size. Position of legend in the current subplot is determined by parameter x, y which supposed to be normalized to interval [0,1].
Adds string text to internal legend accumulator. The style of described line and mark is specified in string stl (see section Line styles). Maximal number of entries is 100.
Clears saved legend strings.
valSwitches on/off the drawing of a box near legend. By default, the box is drawn.
valSet the number of marks in the legend. By default 1 mark is used.
| [ < ] | [ > ] | [ << ] | [ Up ] | [ >> ] | [Top] | [Contents] | [Index] | [ ? ] |
These commands perform plotting of 1D data. 1D means that data depended from only 1 parameter like parametric curve {x(i),y(i),z(i)}, i=1...n. There are 5 generally different types of data representations: simple line plot (plot), line plot with filling under it (area), stairs plot (step), bar plot (bars, barh) and vertical lines (stem). Each type of plotting has similar interface. Most of plotting type has similar interface. There are 3D version and two 2D versions. One of last requires single array. The parameters of line and marks are specified by the string argument. If the string parameter is NULL then solid line with color from palette is used (see section Line styles). Also there are some special 1d plots having slightly different interface: surface of curve rotation (torus), chart (chart) and error boxes (error), marks with variable size (mark), tubes (tube) and so on. See section 1D plot sample, for sample code and picture.
The plots are drawn for each row if one of the data is the matrix. By any case the sizes of 1st dimension must be equal for all arrays xdat.nx=ydat.nx=zdat.nx. If array xdat is not specified then its an automatic array is used with values equidistantly distributed along x. If array zdat is not specified then zdat[i] = zval is used (the default is at the bottom of the bounding box). String stl specifies the color and style of line and marks (see section Line styles). By default (stl='') solid line with color from palette is used (see section Line styles).
zval=nan]zval=nan]Draws continuous lines between points {xdat[i], ydat[i], zdat[i]}. See also area, step, stem, tube, mark, error, belt, tens. See section Plot sample, for sample code and picture.
r=-1]Draws radar chart which is continuous lines between points located on an radial lines (like plot in Polar coordinates). The plots are drawn for each row if one of the data is the matrix. Parameter r set the additional shift of data (i.e. the data adat+r is used instead of adat). If r<0 then r=max(0, -min(adat). String pen specifies the color and style of line and marks (see section Line styles). By default (stl="") solid line with color from palette is used (see section Line styles). If pen containt ‘#’ symbol then "grid" (radial lines and circle for r) is drawn See also plot. See section Radar sample, for sample code and picture.
zval=nan]zval=nan]Draws continuous lines between points {xdat[i], ydat[i], zdat[i]} with color defined by cdat[i] (look like tension plot). See also plot, mesh, fall. See section Tens sample, for sample code and picture.
zval=nan]zval=nan]Draws continuous lines between points {xdat[i], ydat[i], zdat[i]} and fills it down to axis (to axis plane in 3D). You can use gradient filling if number of specified colors is equal to 2*number of curves. If string contain symbol ‘a’ then lines are drawn one above another (like summation). See also plot, bars, stem, region. See section Area sample, for sample code and picture.
inside=off]inside=off]Fills area between curves {xdat[i], fdat[i]} and {xdat[i], gdat[i]}. Parameter inside=off set to fill are with y1<y<y2 else the area with y2<y<y1 will be also filled. You can use gradient filling if number of specified colors is equal to 2*number of curves. See also area, bars, stem. See section Region sample, for sample code and picture.
zval=nan]zval=nan]Draws vertical lines from points {xdat[i], ydat[i], zdat[i]} to axis (to axis plane in 3D). See also area, bars, plot, mark. See section Stem sample, for sample code and picture.
zval=nan]zval=nan]Draws vertical bars from points {xdat[i], ydat[i], zdat[i]} to axis (to axis plane in 3D). If style contain symbol ‘a’ then lines are drawn one above another. If string contain symbol ‘f’ then waterfall chart is drawn for determining the cumulative effect of sequentially introduced positive or negative values. You can different colors for positive and negative values if number of specified colors is equal to 2*number of curves. See also barh, area, stem, chart. See section Bars sample, for sample code and picture.
zval=nan]zval=nan]Draws horizontal bars from points {xdat[i], ydat[i], zdat[i]} to y-axis. If array ydat is not specified then its an automatic array is used with values equidistantly distributed along y. Marks at data points are not drawn. If style contain symbol ‘a’ then lines are drawn one above another. If string contain symbol ‘f’ then waterfall chart is drawn for determining the cumulative effect of sequentially introduced positive or negative values. You can different colors for positive and negative values if number of specified colors is equal to 2*number of curves. See also bars. See section Barh sample, for sample code and picture.
The command draws colored stripes (boxes) for data in array adat. The number of stripes is equal to the number of rows in adat (equal to a.ny). The color of each next stripe is cyclically changed from colors specified in string col or in palette. Spaces in colors denote transparent “color”, i.e. if col contain space(s) then corresponding stripe(s) are not drawn. The stripe width is proportional to value of element in a. Chart is plotted only for data with non-negative elements. If string col have symbol ‘#’ then black border lines are drawn. The most nice form the chart have in 3d (after rotation of coordinates) or in cylindrical coordinates (becomes so called Pie chart). See section Chart sample, for sample code and picture.
zval=nan]zval=nan]Draws continuous stairs for points {xdat[i], ydat[i], zdat[i]}. See also plot, stem, tile, boxs. See section Step sample, for sample code and picture.
Draws surface which is result of curve {rdat[i], zdat[i], zdat[i]} rotation around axialdir axis. If array rdat is not specified then its an automatic array is used with values equidistantly distributed along x. See also plot, axial. See section Torus sample, for sample code and picture.
zval=nan]rval ['stl'='' zval=nan]zval=nan]rval ['stl'='' zval=nan]rval ['stl'='']Draws tube with variable radius rdat[i] (or rval) at points {xdat[i], ydat[i], zdat[i]}. See also plot. See section Tube sample, for sample code and picture.
zval=nan]zval=nan]Draws marks with size rdat[i]*marksize at points {xdat[i], ydat[i], zdat[i]}. See also plot, textmark, stem, error. See section Mark sample, for sample code and picture.
zval=nan]zval=nan]zval=nan]Draws string txt as marks with size rdat[i]*marksize at points {xdat[i], ydat[i], zdat[i]}. If array rdat is not specified then rdat[i] = 1. See also plot, mark, stem. See section Error sample, for sample code and picture.
zval=nan]zval=nan]zval=nan]Draws error boxes {xerr[i], yerr[i]} at points {xdat[i], ydat[i], zval}. See also plot. See section TextMark sample, for sample code and picture.
zval=nan]zval=nan]Draws boxplot (also known as a box-and-whisker diagram) at points xdat in plane z=zval (by default is at the bottom of the bounding box). This is five-number summaries of data <em>adat</em> (minimum, lower quartile (Q1), median (Q2), upper quartile (Q3) and maximum) along second (j-th) direction. See also plot, error, bars. See section BoxPlot sample, for sample code and picture.
| [ < ] | [ > ] | [ << ] | [ Up ] | [ >> ] | [Top] | [Contents] | [Index] | [ ? ] |
These commands perform plotting of 2D data. 2D means that data depend from 2 independent parameters like matrix f(x_i,y_j), i=1...n, j=1...m. There are 6 generally different types of data representations: simple mesh lines plot (mesh), surface plot (surf), surface plot by boxes (boxs), surface plot by tiles (tile), waterfall-like plot (fall), belt plot (belt), density plot (dens), contour lines plot (cont), solid contours plot (contf) and its rotational figure (axial). Commands cont, contf and axial have variants for automatic and manual selection of level values for contours. Also there are commands for plotting data grid lines according to the data format (grid) for enhancing density or contour plots. Each type of plotting has similar interface. There are 2 kind of versions which handle the arrays of data and coordinates or only single data array. See section 2D plot sample, for sample code and picture.
String parameter sch sets the color scheme (see section Color scheme). Previous color scheme is used by default. The minor dimensions of arrays xdat, ydat, zdat should be equal xdat.nx=zdat.nx && ydat.nx=zdat.ny or xdat.nx=ydat.nx=zdat.nx && xdat.ny=ydat.ny=zdat.ny. Arrays xdat and ydat can be vectors (not matrices as zdat). If array xdat, ydat is not specified then its an automatic arrays are used with values equidistantly distributed along x, y. Graphics are plotted for each z-slice of the data.
Draws surface specified parametrically {xdat[i,j], ydat[i,j], zdat[i,j]}. See also mesh, dens, belt, tile, boxs, surfc, surfa. See section Surf sample, for sample code and picture.
Draws mesh lines for surface specified parametrically {xdat[i,j], ydat[i,j], zdat[i,j]}. See also surf, fall, meshnum, cont, tens. See section Mesh sample, for sample code and picture.
Draws fall lines for surface specified parametrically {xdat[i,j], ydat[i,j], zdat[i,j]}. If sch contain ‘x’ then lines are drawn along x-direction else (by default) lines are drawn along y-direction. See also belt, mesh, tens, meshnum. See section Fall sample, for sample code and picture.
Draws belts for surface specified parametrically {xdat[i,j], ydat[i,j], zdat[i,j]}. If sch contain ‘x’ then belts are drawn along x-direction else (by default) lines are drawn along y-direction. See also fall, surf, plot, meshnum. See section Belt sample, for sample code and picture.
Draws vertical boxes for surface specified parametrically {xdat[i,j], ydat[i,j], zdat[i,j]}. See also surf, dens, tile, step. See section Boxs sample, for sample code and picture.
Draws horizontal tiles for surface specified parametrically {xdat[i,j], ydat[i,j], zdat[i,j]}. Such plot can be used as 3d generalization of step. See also surf, boxs, step, tiles. See section Tile sample, for sample code and picture.
zval=nan]zval=nan]Draws density plot for surface specified parametrically {xdat[i,j], ydat[i,j], zdat[i,j]} at z = zVal. See also surf, cont, contf, boxs, tile, dens[xyz]. See section Dens sample, for sample code and picture.
zval=nan]zval=nan]Draws contour lines for surface specified parametrically {xdat[i,j], ydat[i,j], zdat[i,j]} at z = zVal (or for z=vdat[k] if zval=nan). Contours are plotted for zdat[i,j]=vdat[k] for all k. If string stl contain ’t’ (or ’T’) symbol then contour labels will be drawn below (or above) the contours. See also dens, contf, contd, axial, cont[xyz]. See section Cont sample, for sample code and picture.
num=7 zval=nan]num=7 zval=nan]The same as previous one with vector vdat of num-th elements equidistantly distributed in color range (see, caxis).
zval=nan]zval=nan]Draws solid (or filled) contours for surface specified parametrically {xdat[i,j], ydat[i,j], zdat[i,j]} at z = zVal (or for z=vdat[k] if zval=nan). Contours are plotted for zdat[i,j]=vdat[k] for all k (must be vdat.nx>2). See also dens, cont, contd, contf[xyz]. See section ContF sample, for sample code and picture.
num=7 zval=nan]num=7 zval=nan]The same as previous one with vector vdat of num-th elements equidistantly distributed in color range (see, caxis).
zval=nan]zval=nan]Draws solid (or filled) contours for surface specified parametrically {xdat[i,j], ydat[i,j], zdat[i,j]} at z = zVal (or for z=vdat[k] if zval=nan) with manual colors. Contours are plotted for zdat[i,j]=vdat[k] for all k (must be vdat.nx>2). The color of k-th contour is sch[k%strlen(sch)]. See also dens, cont, contf. See section ContD sample, for sample code and picture.
num=7 zval=nan]num=7 zval=nan]The same as previous one with vector vdat of num-th elements equidistantly distributed in color range (see, caxis).
Draws surface which is result of contour plot rotation surface specified parametrically {xdat[i,j], ydat[i,j], zdat[i,j]}. Contours are plotted for zdat[i,j]=vdat[k] for all k. If string sch have symbol ‘#’ then wire plot is produced. If string sch contain symbols ‘x’, ‘y’ or ‘z’ then rotation axis axialdir will be set to specified direction. If string sch have symbol ‘#’ then wire plot is produced. See also cont, contf, torus, surf3. See section Axial sample, for sample code and picture.
num=3]num=3]The same as previous one with vector vdat of num-th elements equidistantly distributed in color range (see, caxis).
num=5 zval=nan]num=5 zval=nan]num=5]Draws gradient lines for scalar field pdat specified parametrically {xdat[i,j], ydat[i,j]} or {xdat[i,j,k], ydat[i,j,k], zdat[i,j,k]}. String sch sets the color scheme. Previous color scheme is used by default. Number of lines is proportional to num. If num<0 then lines start from borders only. See also dens, cont, dens3, cont3, flow. See section Grad sample, for sample code and picture.
zval=nan]zval=nan]Draws grid lines for density plot of surface specified parametrically {xdat[i,j], ydat[i,j], zdat[i,j]} at z = zVal. See also dens, cont, contf.
| [ < ] | [ > ] | [ << ] | [ Up ] | [ >> ] | [Top] | [Contents] | [Index] | [ ? ] |
These commands perform plotting of 3D data. 3D means that data depend from 3 independent parameters like matrix f(x_i,y_j,z_k), i=1...n, j=1...m, k=1...l. There are 4 generally different types of data representations: isosurface or surface of constant value (surf3), density plot at slices (Dens3), contour lines plot at slices (cont3), solid contours plot at slices (contf3) and cloud-like plot (cloud). Commands surf3, cont3 and contf3 have variants for automatic and manual selection of level values for surfaces/contours. Also there are commands for plotting data grid lines according to the data format (grid3) for enhancing density or contour plots. Each type of plotting has similar interface. There are 2 kind of versions which handle the arrays of data and coordinates or only single data array. See section 3D plot sample, for sample code and picture.
String paramter sch sets the color scheme (see section Color scheme). Previous color scheme is used by default. Arrays x, y, z can be vectors (not 3d arrays as a). If array xdat, ydat, zdat is not specified then its an automatic arrays are used with values equidistantly distributed along x, y, z.
val ['sch'='']val ['sch'='']Draws isosurface plot for 3d array specified parametrically adat[i,j,k](xdat[i,j,k], ydat[i,j,k], zdat[i,j,k]) at a(x,y,z)=val. If string contain ‘#’ then wire plot is produced. See also cloud, dens3, surf3c, surf3a, axial. See section Surf3 sample, for sample code and picture.
num=5]num=5]Draws num-th uniformly distributed in color range (see caxis) isosurfaces for 3d data specified parametrically.
sval=-1 'sch'='']sval=-1 'sch'='']Draws density plot for 3d array specified parametrically adat[i,j,k](xdat[i,j,k], ydat[i,j,k], zdat[i,j,k]). Density is plotted at slice sval in dir={‘x’, ‘y’, ‘z’} direction. If string stl have symbol ‘#’ then grid lines are drawn. See also cont3, contf3, dens, grid3. See section Dens3 sample, for sample code and picture.
Draws density plots at all central slices of the 3d data specified parametrically.
sval=-1 'sch'='']sval=-1 'sch'='']Draws contour plot for 3d array specified parametrically adat[i,j,k](xdat[i,j,k], ydat[i,j,k], zdat[i,j,k]). Contours are plotted for values specified in array vdat at slice sval in dir={‘x’, ‘y’, ‘z’} direction. If string stl have symbol ‘#’ then grid lines are drawn. If string stl contain ’t’ (or ’T’) symbol then contour labels will be drawn below (or above) the contours. See also dens3, contf3, cont, grid3. See section Cont3 sample, for sample code and picture.
sval=-1 'sch'='' num=7]sval=-1 'sch'='' num=7]The same as previous one with vector vdat of num-th elements equidistantly distributed in color range (see caxis).
num=7]num=7]Draws contour plots at all central slices of the 3d data specified parametrically.
sval=-1 'sch'='']sval=-1 'sch'='']Draws solid contour plot for 3d array specified parametrically adat[i,j,k](xdat[i,j,k], ydat[i,j,k], zdat[i,j,k]). Contours are plotted for values specified in array vdat at slice sval in dir={‘x’, ‘y’, ‘z’} direction. If string stl have symbol ‘#’ then grid lines are drawn. See also dens3, cont3, contf, grid3. See section ContF3 sample, for sample code and picture.
sval=-1 'sch'='' num=7]sval=-1 'sch'='' num=7]The same as previous one with vector vdat of num-th elements equidistantly distributed in color range (see caxis).
num=7]num=7]Draws solid contour plots at all central slices of the 3d data specified parametrically.
sval=-1 'sch'='']sval=-1 'sch'='']Draws grid for 3d array specified parametrically adat[i,j,k](xdat[i,j,k], ydat[i,j,k], zdat[i,j,k]). Grid is plotted at slice sval in dir={‘x’, ‘y’, ‘z’} direction. See also cont3, contf3, dens3, grid2. See section Dens3 sample, for sample code and picture.
Draws grids at all central slices of the 3d data specified parametrically.
Draws cloud for 3d array specified parametrically adat[i,j,k](xdat[i,j,k], ydat[i,j,k], zdat[i,j,k]). This plot is a set of cubes with color and transparency proportional to value of adat. The resulting plot is like cloud – low value is transparent but higher ones are not. The number of plotting cells depend on meshnum. Paramater alpha changes the overall transparency of plot. See also surf3. See section Cloud sample, for sample code and picture.
rval ['sch'='' flag=0 num=3]Draws num-th uniformly distributed in color range (see caxis) isosurfaces for 3d array adat. This is special kind of plot for adat specified in accompanied coordinates along curve tr with orts g1, g2 and with transverse scale rval. Variable flag is bitwise: ‘0x1’ - draw in accompanied (not laboratory) coordinates; ‘0x2’ - draw projection to \rho-z plane; ‘0x4’ - draw normalized in each slice field. The x-size of data arrays tr, g1, g2 must be nx>2. The y-size of data arrays tr, g1, g2 and z-size of the data array a must be equal. See also surf3.
| [ < ] | [ > ] | [ << ] | [ Up ] | [ >> ] | [Top] | [Contents] | [Index] | [ ? ] |
These plotting commands draw two matrix simultaneously. There are 5 generally different types of data representations: surface or isosurface colored by other data (surfc, surf3c), surface or isosurface transpared by other data (surfa, surf3a), tiles with variable size (tiles), mapping diagram (map), STFA diagram (stfa). Commands surf3a and surf3c have variants for automatic and manual selection of level values for isosurfaces. Each type of plotting has similar interface. There are 2 kind of versions which handle the arrays of data and coordinates or only single data array.
String paramter sch sets the color scheme (see section Color scheme). Previous color scheme is used by default. Arrays x, y, z can be vectors (not 3d arrays as a). If array xdat, ydat, zdat is not specified then its an automatic arrays are used with values equidistantly distributed along x, y, z.
Draws surface specified parametrically {xdat[i,j], ydat[i,j], zdat[i,j]} and color it by matrix cdat[i,j]. See also surf, surfa, surf3c. See section SurfC sample, for sample code and picture.
val ['sch'='']val ['sch'='']Draws isosurface plot for 3d array specified parametrically adat[i,j,k](xdat[i,j,k], ydat[i,j,k], zdat[i,j,k]) at a(x,y,z)=val. It is mostly the same as surf3 command but the color of isosurface depends on values of array cdat. If string contain ‘#’ then wire plot is produced. See also surf3, surfc, surf3a. See section Surf3C sample, for sample code and picture.
num=5]num=5]Draws num-th uniformly distributed in color range (see caxis) isosurfaces for 3d data specified parametrically.
Draws surface specified parametrically {xdat[i,j], ydat[i,j], zdat[i,j]} and transparent it by matrix cdat[i,j]. See also surf, surfc, surf3a, tiles. See section SurfA sample, for sample code and picture.
val ['sch'='']val ['sch'='']Draws isosurface plot for 3d array specified parametrically adat[i,j,k](xdat[i,j,k], ydat[i,j,k], zdat[i,j,k]) at a(x,y,z)=val. It is mostly the same as surf3 command but the transparency of isosurface depends on values of array cdat. If string contain ‘#’ then wire plot is produced. See also surf3, surfa, surf3c. See section Surf3A sample, for sample code and picture.
num=5]num=5]Draws num-th uniformly distributed in color range (see caxis) isosurfaces for 3d data specified parametrically.
Draws horizontal tiles for surface specified parametrically {xdat[i,j], ydat[i,j], zdat[i,j]}. It is mostly the same as tile but the size of tiles is determined by rdat array. See also surfa, tile. See section TileS sample, for sample code and picture.
pnts=on]pnts=on]Draws mapping plot for matrixes {udat, vdat } which parametrically depend on coordinates xdat, ydat. The previous position of the cell (point) is marked by color. Height is proportional to Jacobian(udat,vdat). This plot is like Arnold diagram ???. If pnts=off then face is drawn otherwise the color ball at matrix knots are drawn. The size of udat and vdat must be the same. See section Map sample, for sample code and picture.
dn ['sch'='' pnts=on]dn ['sch'='' pnts=on]Draws spectrogram of complex array re+i*im for Fourier size of dn points at plane z=zVal. Parameter dn is arbitrary even integer. For example in 1D case, result is density plot of data res[i,j]=|\sum_d^dn exp(I*j*d)*(re[i*dn+d]+I*im[i*dn+d])|/dn with size {int(nx/dn), dn, ny}. See section STFA sample, for sample code and picture.
| [ < ] | [ > ] | [ << ] | [ Up ] | [ >> ] | [Top] | [Contents] | [Index] | [ ? ] |
These commands perform plotting of 2D and 3D vector fields. There are 6 generally different types of vector fields representations: simple vector field (vect), vector field by dew-drops (dew), flow threads (flow), flow pipes (pipe), vectors along a curve (traj). Each type of plotting has similar interface. There are 2 kind of versions which handle the arrays of data and coordinates or only single data array. Parameters of color scheme are specified by the string argument. See section Color scheme.
The color is specified by the string argument sch. Previous color scheme is used by default. Parameter flag setup the hachures (arrows). It is combination of values: 1 for drawing bi-color arrow, 2 for drawing fixed length arrows, 4 for drawing arrows to the cell point, 8 for drawing arrows with center at cell point, 16 for drawing hachures with dots instead of arrows.
The size of udat, vdat and wdat must be equal. The minor dimensions of arrays xdat, ydat, zdat and udat must be equal too. Arrays xdat, ydat and zdat can be vectors (not matrices as udat). The graphics is plotted for each z slice of udat, vdat for 2D case.
zval=nan len=0]len=0]Draws vectors {udat, vdat, wdat} along a curve xdat, ydat, zdat. The length and color of arrows are proportional to \sqrtudat^2+vdat^2+wdat^2. See also vect. See section Traj sample, for sample code and picture.
zval=nan flag=0]zval=nan flag=0]Draws plane vector field plot for the field {udat, vdat} depending parametrically on coordinates xdat, ydat at level z=zval. The length and color of arrows are proportional to \sqrtudat^2+vdat^2. The number of arrows depend on meshnum. See also flow, dew, vectc. See section Vect sample, for sample code and picture.
flag=0]flag=0]This is 3D version of the previous command. Here arrays udat, vdat, wdat must be 3-ranged tensors with equal sizes and the length and color of arrows are proportional to \sqrtudat^2+vdat^2+wdat^2. See section Vect 3D sample, for sample code and picture.
zval=nan]zval=nan]Draws plane vector field plot for the field {udat, vdat} depending parametrically on coordinates xdat, ydat at level z=zVal. The color of hachures is proportional to \sqrtudat^2+vdat^2. The number of hachures depend on meshnum. See also vect, flow, pipe, dew. See section VectC sample, for sample code and picture.
This is 3D version of the previous command. Here arrays udat, vdat, wdat must be 3-ranged tensors with equal sizes and the color of hachures is proportional to \sqrtudat^2+vdat^2+wdat^2. See section VectC 3D sample, for sample code and picture.
zval=nan]zval=nan]Draws plane vector field plot for the field {udat, vdat} depending parametrically on coordinates xdat, ydat at level z=zVal. The length of hachures is proportional to \sqrtudat^2+vdat^2. The number of hachures depend on meshnum. See also vectc, flow, pipe, dew. See section Vect sample, for sample code and picture.
This is 3D version of the previous command. Here arrays udat, vdat, wdat must be 3-ranged tensors with equal sizes and the length of hachures is proportional to \sqrtudat^2+vdat^2+wdat^2. See section VectL 3D sample, for sample code and picture.
zval=nan]zval=nan]Draws dew-drops for plane vector field {udat, vdat} depending parametrically on coordinates xdat, ydat at level z=zval. The color of drops is proportional to \sqrtudat^2+vdat^2. The number of drops depend on meshnum. Note that this is very expensive plot in memory usage and creation time! See also vect. See section Dew sample, for sample code and picture.
num=5 zval=nan]num=5 zval=nan]Draws plane flow threads for the vector field {udat, vdat} depending parametrically on coordinates xdat, ydat at level z=zVal. Number of threads is proportional to num. The color of lines is proportional to \sqrtudat^2+vdat^2. Warm color corresponds to normal flow (like attractor). Cold one corresponds to inverse flow (like source). See also vect, vectc, pipe. See section Flow sample, for sample code and picture.
num=3]num=3]This is 3D version of the previous command. Here arrays udat, vdat, wdat must be 3-ranged tensors with equal sizes and the color is proportional to \sqrtudat^2+vdat^2+wdat^2. See section Flow 3D sample, for sample code and picture.
x0 y0 udat vdat ['sch'='' zval=nan]x0 y0 xdat ydat udat vdat ['sch'='' zval=nan]Draws plane flow threads for the vector field {udat, vdat} depending parametrically on coordinates xdat, ydat from point {x0, y0} at level z=zVal. The color of lines is proportional to \sqrtudat^2+vdat^2. Warm color corresponds to normal flow (like attractor). Cold one corresponds to inverse flow (like source). See also vect, vectc, pipe. See section Flow sample, for sample code and picture.
x0 y0 z0 udat vdat wdat ['sch'='']x0 y0 z0 xdat ydat zdat udat vdat wdat ['sch'='']Draws flow thread from point {x0, y0, z0}. Arrays udat, vdat, wdat must be 3-ranged tensors with equal sizes and the color is proportional to \sqrtudat^2+vdat^2+wdat^2. See section Flow 3D sample, for sample code and picture.
r0=0.05 num=5 zval=nan]r0=0.05 num=5 zval=nan]Draws plane flow pipes for the vector field {udat, vdat} depending parametrically on coordinates xdat, ydat at level z=zVal. Number of pipes is proportional to num. The color of pipes is proportional to \sqrtudat^2+vdat^2. Warm color corresponds to normal flow (like attractor). Cold one corresponds to inverse flow (like source). Parameter r0 set the base pipe radius. If r0<0 then pipe radius is inverse proportional to amplitude. The size of ax and ay must be equal. See also vect, vectc, pipe. See section Pipe sample, for sample code and picture.
r0=0.05 num=3]r0=0.05 num=3]This is 3D version of the previous command. Here arrays udat, vdat, wdat must be 3-ranged tensors with equal sizes and the color is proportional to \sqrtudat^2+vdat^2+wdat^2. See section Pipe 3D sample, for sample code and picture.
| [ < ] | [ > ] | [ << ] | [ Up ] | [ >> ] | [Top] | [Contents] | [Index] | [ ? ] |
These commands perform miscelaneous plotting. There is unstructured data points plots (Dots), surface reconstruction (Crust), surfaces on the triangular mesh (TriPlot) or quadrangular mesh (QuadPlot), textual formula plotting (Plots by formula), data plots at edges (Dens[XYZ], Cont[XYZ], ContF[XYZ]), simple plot (SimplePlot). Each type of plotting has similar interface. There are 2 kind of versions which handle the arrays of data and coordinates or only single data array. Parameters of color scheme are specified by the string argument. See section Color scheme.
val=nan]val=nan]val=nan]These plotting commands draw density plot in x, y or z plain. If dat is a tensor (3-dimensional data) then interpolation to a given val is performed. These commands are useful for creating projections of the 3D data array to the bounding box. See also cont[xyz], contf[xyz], dens. See section Dens projection sample, for sample code and picture.
val=nan num=7]val=nan num=7]val=nan num=7]These plotting commands draw contour lines in x, y or z plain. If dat is a tensor (3-dimensional data) then interpolation to a given val is performed. These commands are useful for creating projections of the 3D data array to the bounding box. See also dens[xyz], contf[xyz], cont. See section Cont projection sample, for sample code and picture.
val=nan num=7]val=nan num=7]val=nan num=7]These plotting commands draw solid contours in x, y or z plain. If dat is a tensor (3-dimensional data) then interpolation to a given val is performed. These commands are useful for creating projections of the 3D data array to the bounding box. See also dens[xyz], cont[xyz], contf.
Draws the arbitrary placed points {xdat[i], ydat[i], zdat[i]}. Variable adat[i] set transparency for dots. See also crust, mark, plot. See section Dots sample, for sample code and picture.
Reconstructs and draws the surface for arbitrary placed points {xdat[i], ydat[i], zdat[i]}. If string contain ‘#’ then wire plot is produced. See also dots, triplot. See section Crust sample, for sample code and picture.
zval=nan]Draws the surface of triangles. Triangle vertexes are set by indexes idat of data points {xdat[i], ydat[i], zdat[i]}. If string contain ‘#’ then wire plot is produced. First dimensions of idat must be 3 or greater. See also dots, crust, quadplot. Parameter cdat set the colors of triangles (if idat.ny=cdat.nx) or colors of vertexes (if xdat.nx=cdat.nx). See also dots, crust, quadplot, tricont.
zval=nan]zval=nan]num=7 zval=nan]Draws contour lines for surface of triangles at z = zVal (or for z=vdat[k] if zval=nan). Triangle vertexes are set by indexes idat of data points {xdat[i], ydat[i], zdat[i]}. Contours are plotted for zdat[i,j]=vdat[k] for all k (or num contours equidistantly distributed in range [Cmin, Cmax].). See also triplot, cont.
zval=nan]Draws the surface of quadrangles. Quadrangle vertexes are set by indexes idat of data points {xdat[i], ydat[i], zdat[i]}. If string contain ‘#’ then wire plot is produced. First dimensions of idat must be 4 or greater. See also triplot, dots, crust. Parameter cdat set the colors of triangles (if idat.ny=cdat.nx) or colors of vertexes (if xdat.nx=cdat.nx). See also triplot.
zval=nan num=100]Draws command function ‘y(x)’ at plane z=zval where ‘x’ variable is changed in xrange. You do not need to create the data arrays to plot it. The parameter num set the minimal number of points along coordinate(s) for plots. See also plot.
num=100]Draws command parametrical curve {‘x(t)’, ‘y(t)’, ‘z(t)’} where ‘t’ variable is changed in range [0, 1]. You do not need to create the data arrays to plot it. The parameter num set the minimal number of points along coordinate(s) for plots. See also plot.
num=100]Draws command surface for function ‘z(x,y)’ where ‘x’, ‘y’ variable are changed in xrange, yrange. You do not need to create the data arrays to plot it. The parameter num set the minimal number of points along coordinate(s) for plots. See also surf.
num=100]Draws command parametrical surface {‘x(u,v)’, ‘y(u,v)’, ‘z(u,v)’} where ‘u’, ‘v’ variable are changed in range [0, 1]. You do not need to create the data arrays to plot it. The parameter num set the minimal number of points along coordinate(s) for plots. See also surf.
| [ < ] | [ > ] | [ << ] | [ Up ] | [ >> ] | [Top] | [Contents] | [Index] | [ ? ] |
These commands fit data to formula. Fitting goal is to find formula parameters for the best fit the data points, i.e. to minimize the sum \sum_i (f(x_i, y_i, z_i) - a_i)^2/s_i^2. At this, approximation function ‘f’ can depend only on one argument ‘x’ (1D case), on two arguments ‘x,y’ (2D case) and on three arguments ‘x,y,z’ (3D case). The command ‘f’ also may depend on parameters. Normally the list of fitted parameters is specified by var string (like, ‘abcd’). Usually user should supply initial values for fitted parameters by ini variable. But if he/she don’t supply it then the zeros are used.
Commands fit and fits do not draw the obtained data themselves. They fill the data out by formula ‘f’ with found coefficients. At this, the ‘x,y,z’ coordinates are equidistantly distributed in the bounding box. Number of points in out is selected as maximal value of out size or 100. Also you may print the last formula with found coefficients by putsfit command. See section Fitting sample, for sample code and picture.
The dimensions of arrays must be at least the same as the number of specified arrays xdat, ydat, zdat. Also the fitting only along specified directions will be performed (for example, along x and y if only xdat and ydat are specified). If array xdat is not specified then its an automatic array is used with values equidistantly distributed along x.
Fit data along x-, y- and z-directions for 1d-,2d- or 3d array specified parametrically adat[i,j,k](xdat[i,j,k], ydat[i,j,k], zdat[i,j,k]) with weight factor sdat[i,j,k].
Fit data along x-, y- and z-directions for 1d-,2d- or 3d array specified parametrically adat[i,j,k](xdat[i,j,k], ydat[i,j,k], zdat[i,j,k]) with weight factor =1.
x y ['pre'='' 'fnt'='' size=-1]Print last fitted formula with found coefficients (as numbers) at position {x, y}. The string pre will be printed before formula. All other parameters are the same as in Text printing.
| [ < ] | [ > ] | [ << ] | [ Up ] | [ >> ] | [Top] | [Contents] | [Index] | [ ? ] |
nx=1 ny=1 nz=1]Creates or recreates the array dat with specified size and fills it by zero. This command does nothing if one of parameters nx, ny, nz is zero or negative.
num v1 [v2=nan]Creates new variable with name dat for one-dimensional array of size num. Array elements are equidistantly distributed in range [v1, v2]. If v2=nan then v2=v1 is used.
v1 ...Creates new variable with name dat and fills it by numeric values of command arguments v1 .... Command can create one-dimensional and two-dimensional arrays with arbitrary values. For creating 2d array the user should use delimiter ‘|’ which means that the following values lie in next row. Array sizes are [maximal of row sizes * number of rows]. For example, command list 1 | 2 3 creates the array [1 0; 2 3]. Note, that the maximal number of arguments is 1000.
Creates new variable with name dat and fills it by data values of arrays of command arguments d1 .... Command can create two-dimensional or three-dimensional (if arrays in arguments are 2d arrays) arrays with arbitrary values. Minor dimensions of all arrays in arguments should be equal to dimensions of first array d1. In the opposite case the argument will be ignored. Note, that the maximal number of arguments is 1000.
on_axis=on]valCreates new variable with name dat1 and fills it by data values of array dat2. At this, if parameter eq is specified then the data will be modified by corresponding formula by the same way as in fill command (for on_axis=on) or in modify command (for on_axis=off).
Set the symbol id for data columns. The string must contain one symbol ’a’...’z’ per column (without spaces).
detail=off]Display information (sizes, maximum/minimum, momentums and so on) about the data dat. Show brief information by default (if detail=off).
Display text as information (warning).
| [ < ] | [ > ] | [ << ] | [ Up ] | [ >> ] | [Top] | [Contents] | [Index] | [ ? ] |
Equidistantly fills the data values to range [x1, x2] in direction dir={‘x’,‘y’,‘z’}.
Command fills the value of array according to the formula in string eq. Formula is an arbitrary expression depending on variables ‘x’, ‘y’, ‘z’, ‘u’, ‘v’, ‘w’. Coordinates ‘x’, ‘y’, ‘z’ are supposed to be normalized in bounding box (in difference from modify commands). Variable ‘u’ is the original value of the array. Variables ‘v’ and ‘w’ are values of vdat, wdat.
dim=0]Command fills the value of array according to the formula in string eq. Formula is an arbitrary expression depending on variables ‘x’, ‘y’, ‘z’, ‘u’. Coordinates ‘x’, ‘y’, ‘z’ are data indexes normalized in range [0,1]. Variable ‘u’ is the original value of the array. If dim>0 is specified then modification will be fulfilled only for slices >=dim.
val [i=: j=: k=:]Function sets value(s) of array dat[i, j, k] = val. Negative indexes i, j, k=‘:’ set the value val to whole range in corresponding direction(s). For example, put dat val : 0 : sets dat[i,0,j]=val for i=0...(dat.nx-1), j=0...(dat.nz-1).
i=: j=: k=:]Function copies value(s) from array vdat to the range of array dat. Negative indexes i, j, k=‘:’ set the range in corresponding direction(s). At this minor dimensions of array vdat should be large than corresponding dimensions of array dat. For example, put dat v : 0 : sets dat[i,0,j]=vdat.ny>dat.nz ? vdat[i,j] : vdat[i], where i=0...(dat.nx-1), j=0...(dat.nz-1) and condition vdat.nx>=dat.nx is true.
| [ < ] | [ > ] | [ << ] | [ Up ] | [ >> ] | [Top] | [Contents] | [Index] | [ ? ] |
mx [my=0 mz=0]Rearrange dimensions without changing data array so that resulting sizes should be mx*my*mz < nx*ny*nz. If some of parameter my or mz are zero then it will be selected to optimal fill of data array. For example, if my=0 then it will be change to my=nx*ny*nz/mx and mz will be 1.
n1 [n2=0]Increase the dimensions of the data by inserting new (|n1|+1)-th slices after (for n1>0) or before (for n1<0) of existed one. It is possible to insert 2 dimensions simultaneously for 1d data by using parameter n2. Data to new slices is copy from existed one. For example, for n1>0 new array will be a_ij^new = a_i^old where j=0...n1. Correspondingly, for n1<0 new array will be a_ij^new = a_j^old where i=0...|n1|.
Transposes (shift order of) dimensions of the data. New order of dimensions is specified int string dim. This command may be useful also for the reading of one-dimensional data.
rx [ry=1 rz=1 sm=off]Reduces the data size by excluding data elements which indexes are not divisible by rx, ry, rz correspondingly. Parameter sm set to use smoothing (i.e. out[i]=\sum_{j=i}^{i+r} a[j]/r) or not (i.e. out[i]=a[j*r]).
n1 n2 'dir'Cuts off edges of the data i<n1 and i>n2 if n2>0 or i>n[xyz]-n2 if n2<=0 along direction dir.
Deletes variable dat and makes its memory free. Can be useful for huge data arrays.
[pos=off num=0]Delete num slices along dir-direction at position pos.
[pos=off num=0]Insert num slices along dir-direction at position pos.
| [ < ] | [ > ] | [ << ] | [ Up ] | [ >> ] | [Top] | [Contents] | [Index] | [ ? ] |
Reads data from tab-separated text file with auto determining sizes of the data.
mx [my=1 mz=1]Reads data from text file with specified data sizes. This command does nothing if one of parameters mx, my or mz is zero or negative.
dim=2]Read data from text file with size specified at beginning of the file by first dim numbers. At this, variable dim set data dimensions.
v1 v2 [dv=1 slice=off]Join data arrays from several text files. The file names are determined by function call sprintf(fname,templ,val);, where val changes from v1 to v2 with step dv. The data load one-by-one in the same slice if slice=off or as slice-by-slice if slice=on.
[slice=off]Join data arrays from several text files which filenames satisfied the template templ (for example, templ="t_*.dat"). The data load one-by-one in the same slice if slice=off or as slice-by-slice if slice=on.
Saves the whole data array to tab-separated text file.
Reads data array named dname from HDF5 or HDF4 file fname.
Saves data array named dname from HDF5 or HDF4 file fname.
v1=0 v2=1]Reads data from bitmap file. The RGB values of bitmap pixels are transformed to float values in range [v1, v2] using color scheme sch (see section Color scheme).
v1=0 v2=0]Saves data matrix to bitmap file. The data values are transformed from range [v1, v2] to RGB pixels of bitmap using color scheme sch (see section Color scheme). If v1>=v2 then the values of v1, v2 are automatically determined as minimal and maximal value of the data array.
| [ < ] | [ > ] | [ << ] | [ Up ] | [ >> ] | [Top] | [Contents] | [Index] | [ ? ] |
Returns direct multiplication of arrays (like, res[i,j] = adat[i]*bdat[j] and so on).
norm=on]norm=on]norm=on]Get array which values is result of interpolation of original array for coordinates from other arrays (for example, res[i,j]=dat[idat[i,j],jdat[i,j]]). All dimensions must be the same for data idat, jdat, kdat. Coordinates from idat, jdat, kdat are supposed to be normalized in range [0,1] (if norm=true) or in ranges [0,nx], [0,ny], [0,nz] correspondingly.
num v1 v2 [nsub=0]num v1 v2 [nsub=0]Creates num-th points distribution res of the data values of dat in range [v1, v2]. Array wdat specifies weights of the data elements (all weight is 1 if wdat is not specified). Parameter nsub define the number of additional interpolated points (for smoothness of histogram).
Creates distribution res of the data values of adat in axis range [Min, Max]. Array adat look like weights of the data points.
Get momentum (1D-array) of the data along direction dir. String how contain kind of momentum. The momentum is defined like as res_k = \sum_ij how(x_i,y_j,z_k) a_ij/ \sum_ij a_ij if var=‘z’ and so on. Coordinates ‘x’, ‘y’, ‘z’ are data indexes normalized in range [0,1].
Gets array which is the result of summation in given direction or direction(s).
Gets array which is the maximal data values in given direction or direction(s).
Gets array which is the minimal data values in given direction or direction(s).
mx [my=1 mz=1]Makes array res of sizes mx, my, mz with interpolated data of array dat.
xx [yy=: zz=:]Extracts sub-array data res from the original data dat array keeping fixed positive index. For example subdata a b : 2 extracts 3d row (indexes are zero based), subdata a b 4 : extracts 5th column, subdata a b : : 3 extracts 4th slice and so on. Note that symbol ‘:’ is defined ‘:’=-1 in MGL.
Gets array of diagonal elements dat[i,i] (for 2D case) or dat[i,i,i] (for 3D case) where i=0...nx-1. Function return copy of dat for 1D case. Data array must have dimensions dat.ny, dat.nz >= dat.nx or dat.ny, dat.nz = 1.
Do integral transformation of complex data real, imag on specified direction. The order of transformations is specified in string type: first character for x-dimension, second one for y-dimension, third one for z-dimension. The possible character are: ‘f’ is forward Fourier transformation, ‘i’ is inverse Fourier transformation, ‘s’ is Sine transform, ‘c’ is Cosine transform, ‘h’ is Hankel transform, ‘n’ or ‘ ’ is no transformation.
The same as previous but with specified amplitude ampl and phase phase of complex numbers.
dn ['dir'='x']Short time Fourier transformation for real and imaginary parts. Output is amplitude of partial Fourier of length dn. For example if dir=‘x’, result will have size {int(nx/dn), dn, ny} and it will contain res[i,j,k]=|\sum_d^dn exp(I*j*d)*(real[i*dn+d,k]+I*imag[i*dn+d,k])|/dn.
dz=0.1 k0=100]Solves equation du/dz = i*k0*ham(p,q,x,y,z,|u|)[u], where p=-i/k0*d/dx, q=-i/k0*d/dy are pseudo-differential operators. Parameters ini_re, ini_im specify real and imaginary part of initial field distribution. Coordinates of the equation (and the solution) are supposed to be in the bounding box. Note, that really this ranges are increased by factor 3/2 for purpose of reducing reflection from boundaries. Parameter dz set the step along evolutionary coordinate z. At this moment, simplified form of function ham is supported – all “mixed” terms (like ‘x*p’->x*d/dx) are excluded. For example, in 2D case this function is effectively ham = f(p,z) + g(x,z,u). However commutable combinations (like ‘x*q’->x*d/dy) are allowed. Here variable ‘u’ is used for field amplitude |u|. This allow one solve nonlinear problems – for example, for non-linear Shrodinger equation you may set ham='p^2+q^2-u^2'. You may specify imaginary part for wave absorption, like ham = 'p^2+i*x*(x>0)', but only if dependence on variable ‘i’ is linear (i.e. ham = hre+i*him). See section PDE sample, for sample code and picture.
x0 y0 z0 p0 q0 v0 [dt=0.1 tmax=10]Solves GO ray equation like dr/dt = d ham/dp, dp/dt = -d ham/dr. This is Hamiltonian equations for particle trajectory in 3D case. Here ham is Hamiltonian which may depend on coordiantes ‘x’, ‘y’, ‘z’, momentums ‘p’=px, ‘q’=py, ‘v’=pz and time ‘t’: ham = H(x,y,z,p,q,v,t). The starting point (at t=0) is defined by variables {x0, y0, z0, p0, q0, v0}. Parameters dt and tmax specify the integration step and maximal time for ray tracing. Result is array of {x,y,z,p,q,v,t} with dimensions {7 * int(tmax/dt+1) }. See also pde. See section Beam tracing sample, for sample code and picture.
r=1 k0=100 xx=0 yy=0]Solves equation du/dt = i*k0*ham(p,q,x,y,|u|)[u], where p=-i/k0*d/dx, q=-i/k0*d/dy are pseudo-differential operators. Parameters ini_re, ini_im specify real and imaginary part of initial field distribution. Parameters ray set the reference ray, i.e. the ray around which the accompanied coordinate system will be maked. You may use, for example, the array created by ray function. Note, that the reference ray must be smooth enough to make accompanied coodrinates unambiguity. Otherwise errors in the solution may appear. If xx and yy are non-zero then Cartesian coordinates for each point will be written into them. See section Beam tracing sample, for sample code and picture.
Computates the Jacobian for transformation {i,j,k} to {xdat,ydat,zdat} where initial coordinates {i,j,k} are data indexes normalized in range [0,1]. The Jacobian is determined by formula det||dr_\alpha/d\xi_\beta|| where r={xdat,ydat,zdat} and \ xi={i,j,k}. All dimensions must be the same for all data arrays. Data must be 3D if all 3 arrays {xdat,ydat,zdat} are specified or 2D if only 2 arrays {xdat,ydat} are specified.
| [ < ] | [ > ] | [ << ] | [ Up ] | [ >> ] | [Top] | [Contents] | [Index] | [ ? ] |
These commands change the data in some direction like differentiations, integrations and so on. The direction in which the change will applied is specified by the string parameter, which may contain ‘x’, ‘y’ or ‘z’ characters for 1-st, 2-nd and 3-d dimension correspondingly.
Cumulative summation of the data in given direction or directions.
Integrates (like cumulative summation) the data in given direction or directions.
Differentiates the data in given direction or directions.
Differentiates the data dat specified parametrically in direction xdat with ydat, zdat=constant. Parameter zdat can be omitted that correspond to 2D case. Parametrical differentiation uses the formula (for 2D case): da/dx = (a_j*y_i-a_i*y_j)/(x_j*y_i-x_i*y_j) where a_i=da/di, a_j=da/dj denotes usual differentiation along 1st and 2nd dimensions. The similar formula is used for 3D case. Note, that you may change the order of arguments – for example, if you have 2D data a(i,j) which depend on coordinates {x(i,j), y(i,j)} then usual derivative along ‘x’ will be diff a x y and usual derivative along ‘y’ will be diff a y x.
Double-differentiates (like Laplace operator) the data in given direction.
Do Sine transform of the data in given direction or directions. The Sine transform is \sum a_i \sin(k i).
Do Cosine transform of the data in given direction or directions. The Cosine transform is \sum a_i \cos(k i).
Do Hankel transform of the data in given direction or directions. The Hankel transform is \sum a_i J_0(k i).
Swaps the left and right part of the data in given direction (useful for Fourier spectrum).
Rolls the data along direction ’dir’. Resulting array will be out[i] = ini[(i+num)%nx] if dir='x'.
Mirror the left-to-right part of the data in given direction. Looks like change the value index i->n-i.
da=2*pi]Remove value steps (like phase jumps after inverse trigonometric commands) with period da in given direction.
type ['dir'='xyz']Smooths the data on specified direction or directions by method Type. Now 4 methods are supported: ‘0’ does nothing, ‘1’ linear averaging by 3 points, ‘2’ linear averaging by 5 points, ‘3’ quadratic averaging by 5 points.
Find envelop for data values along direction dir. Only one direction can be specified at once.
v1 v2 ['dir'='z' keep=on sym=off]Normalizes data slice-by-slice along direction dir the data in slices to range [v1,v2]. If flag sym=on then symmetrical interval [-max(|v1|,|v2|), max(|v1|,|v2|)] is used. If keep is set then maximal value of k-th slice will be limited by
\sqrt\sum a_ij(k)/\sum a_ij(0).
v1 v2 [sym=off dim=0]Normalizes the data to range [v1,v2]. If flag sym=on then symmetrical interval [-max(|v1|,|v2|), max(|v1|,|v2|)] is used. Modification will be applied only for slices >=dim.
| [ < ] | [ > ] | [ << ] | [ Up ] | [ >> ] | [Top] | [Contents] | [Index] | [ ? ] |
Multiplies the data by the other one for each element.
valMultiplies each element by the number.
Divides the data by the other one for each element.
valDivides each element by the number.
Adds the other data.
valAdds the number to each element.
Subtracts the other data.
valSubtracts the number to each element.
| [ < ] | [ > ] | [ << ] | [ Up ] | [ >> ] | [Top] | [Contents] | [Index] | [ ? ] |
These commands control program flow, like, conditions, cycles, define script arguments and so on.
Changes the current directory to path.
Sets N-th script argument to smth. Note, that smth is used as is (with ‘'’ symbols if present). Here N is digit (0...9) or alpha (a...z).
Create scalar variable name which have the numeric value of smth. Later you can use this variable as usual number. Here N is digit (0...9) or alpha (a...z).
Sets N-th script argument to character with value evaluated from smth. Here N is digit (0...9) or alpha (a...z).
Sets N-th script argument to number with value evaluated from smth. Here N is digit (0...9) or alpha (a...z).
Sets N-th script argument to palette character at position evaluated from smth. Here N is digit (0...9) or alpha (a...z).
Executes function fname (or script if function is not found). Optional arguments will be passed to functions. See also func.
Define the function fname and number of required arguments. The arguments will be placed in script parameters $1, $2, ... $9. Note, you should stop script execution before function definition(s) by command stop. See also return.
Return from the function. See also func.
Starts block which will be executed if dat satisfy to cond.
valStarts block which will be executed if val is nonzero.
Starts block which will be executed if previous if or elseif is false and dat satisfy to cond.
valStarts block which will be executed if previous if or elseif is false and val is nonzero.
Starts block which will be executed if previous if or elseif is false.
Finishes if/elseif/else block.
v1 v2 [dv=1]Starts cycle with $N-th argument changing from v1 to v2 with the step dv. Here N is digit (0...9) or alpha (a...z).
Starts cycle with $N-th argument changing for dat values. Here N is digit (0...9) or alpha (a...z).
Finishes for cycle.
valThe code between once on and once off will be executed only once. Useful for large data manipulation in programs like UDAV.
Terminate execution.
| [ < ] | [ > ] | [ << ] | [ Up ] | [ >> ] | [Top] | [Contents] | [Index] | [ ? ] |
Command options allow the easy setup of the plot by changing of global settings only for this plot. Options are specified at the end of string. Each option is separated from the previous text by symbol ‘;’. Options work so that them remember the current settings, change settings as it being set in the option, execute command and return the original settings back. So, the options usage for data handling commands or for graphics setup commands is useless.
The most useful options are xrange, yrange, zrange. They sets the boundaries for data change. This boundaries are used for automatically filled variables. So, these options allow one to change the position of some plots. For example, in command plot y; xrange 0.1 0.9 the x coordinate will be equidistantly distributed in range 0.1 ... 0.9.
valvalSets alpha value (transparency) of the plot. The value should be in range [0, 1]. See also alphadef.
valSets brightness of ambient light for the plot. The value should be in range [0, 1]. See also ambient.
val1 val2Sets boundaries of color change for the plot. See also crange.
val1 val2Sets boundaries of x coordinate change for the plot. See also xrange.
val1 val2Sets boundaries of y coordinate change for the plot. See also yrange.
val1 val2Sets boundaries of z coordinate change for the plot. See also zrange.
valSets whether to cut or to project the plot points lying outside the bounding box. See also cut.
valSets the size of text. See also font.
valSets the size of marks. See also marksize.
valWork like meshnum command.
Adds string ’txt’ to internal legend accumulator. The style of described line and mark is taken from arguments of the last 1D plotting command. See also legend.
| [ < ] | [ > ] | [ << ] | [ Up ] | [ >> ] | [Top] | [Contents] | [Index] | [ ? ] |
Suffixes can get some numerical value (like its size, maximal or minimal value, the sum of elements and so on) of the data array in variable and use it later as usual number in command arguments. The suffixes start from point ‘.’ right after (without spaces) variable name or its sub-array. For example, a.nx give the x-size of data a, b(1).max give maximal value of second row of variable b, (c(:,0)^2).sum give the sum of squares of elements in the first column of c and so on.
The full list of suffixes are:
Give the data size in x-, y-, z-direction correspondingly.
Give maximal value of the data.
Give minimal value of the data.
Give sum of data values.
Give first value of data array.
Give first nonzero value of data array.
Give last nonzero value of data array.
Give x-, y-, z-position of data maximum.
Give x-, y-, z-position of data mass center or average data value.
Give width in x-, y-, z-direction or data dispersion value.
Give skewness in x-, y-, z-direction or data skewness value.
Give kurtosis in x-, y-, z-direction or data kurtosis value.
| [ < ] | [ > ] | [ << ] | [ Up ] | [ >> ] | [Top] | [Contents] | [Index] | [ ? ] |
MathGL library provides several tools for parsing MGL scripts. There is tools saving it to bitmap (mgl2png, mgl2gif) or vectorial (mgl2eps, mgl2svg) images. Tool mglview show MGL script and allow to rotate and setup the image. Also you can translate MGL script to C++ file by help of mgl2cpp tool.
All of this tools have similar set of arguments. First argument is name of script file, next argument is optional output file name, last arguments are options. There are options for setting script parameters (it is $0, $1, ... $9) and locale settings. The script parameters have format ‘-Nval’. Here N=0,1...9 is parameter ID and val is its value. For example, option ‘-1test’ set to substitute ‘test’ instead of $1 in the script. Option -Lval set locale to val. For example, ‘-Lutf8’ will set UTF-8 locale for script.
Additionally you can create animated GIF file or a set of JPEG files with names ‘frameNNNN.jpg’ (here ‘NNNN’ is frame index). You should use mgl2gif tool and specify the values of $0 parameter for making animation. Values of the parameter $0 can be specified inside the script by comment ##a val for each value val (one comment for one value) or by option(s) ‘-Aval’. Also you can specify a cycle for animation by comment ##c v1 v2 dv or by option -Cn1:n2. Tool mgl2gif will execute script several times (once for each specified value of $0) and save result in animated GIF file. For saving each frame in JPEG just add command write '' at the end of the script.
| [ << ] | [ >> ] | [Top] | [Contents] | [Index] | [ ? ] |
This document was generated by Alexey Balakin on May 31, 2011 using texi2html 1.82.