| [ < ] | [ > ] | [ << ] | [ Up ] | [ >> ] | [Top] | [Contents] | [Index] | [ ? ] |
This chapter contain information about basic and advanced MathGL, hints and samples for all types of graphics. I recommend you read first 2 sections one after another and at least look on “Hints” section. Also I recommend you to look at General concepts. Sample code for some of these examples can be found in http://mathgl.sf.net/pictures.html and in Samples.
| 2.1 Basic usage | ||
| 2.2 Advanced usage | ||
| 2.3 Data handling | ||
| 2.4 Data plotting | ||
| 2.5 Hints |
| [ < ] | [ > ] | [ << ] | [ Up ] | [ >> ] | [Top] | [Contents] | [Index] | [ ? ] |
MGL script can be used by several manners. Each has positive and negative sides:
Positive side is the possibility to view the plot at once and to modify it, rotate, zoom or switch on transparency or lighting) by hand or by mouse. Negative sides are: the need of X-terminal.
Positive aspects are: batch processing of similar data set, for example, a set of resulting data files for different calculation parameters), running from the console program, including the cluster calculation), fast and automated drawing, saving pictures for further analysis, or demonstration). Negative sides are: the usage of the external program for picture viewing. Also, the data plotting is non-visual. So, you have to imagine the picture, view angles, lighting and so on) before the plotting. I recommend to use graphical window for determining the optimal parameters of plotting on the base of some typical data set. And later use these parameters for batch processing in console program.
In this case you can use a set of programs: mgl2png, mgl2gif, mgl2eps, mgl2svg or mglview for viewing.
The simplest script is
box         # draw bounding box
axis        # draw axis
fplot 'x^3' # draw some function
Just type it in UDAV and press F5. Also you can save it in text file ‘test.mgl’ and type in the console mgl2png test.mgl what produce file ‘test.mgl.png’ with resulting picture.
| [ < ] | [ > ] | [ << ] | [ Up ] | [ >> ] | [Top] | [Contents] | [Index] | [ ? ] |
Now I show several non-obvious features of MGL: several subplots in a single picture, curvilinear coordinates, text printing and so on. Generally you may miss this section at first reading, but I don’t recommend it.
| 2.2.1 Subplots | ||
| 2.2.2 Axis and grids | ||
| 2.2.3 Curvilinear coordinates | ||
| 2.2.4 Text printing example |
| [ < ] | [ > ] | [ << ] | [ Up ] | [ >> ] | [Top] | [Contents] | [Index] | [ ? ] |
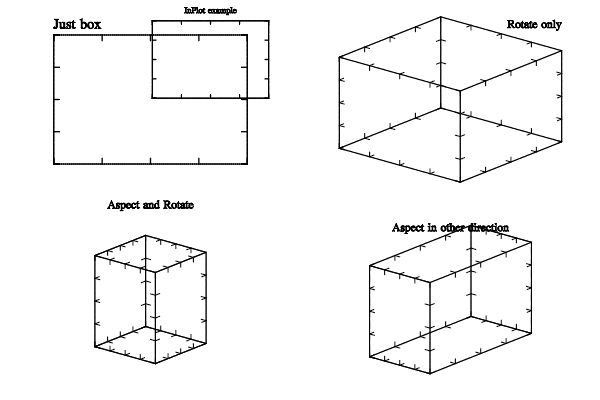
Let me demonstrate possibilities of axes transformation. MathGL has the following functions: SubPlot, InPlot, Aspect and Rotate, see section Transformation matrix). The order of their calling is strictly determined. First, one changes the position of axes in image area, functions SubPlot and InPlot). After that one may rotate the plot, function Rotate). Finally, one may change aspects of axes, function Aspect). The following code illustrates the aforesaid it:
subplot 2 2 0:box
text -1 1.1 'Just box' 'L'
inplot 0.2 0.5 0.7 1:box
text 0 1.2 'Inplot example'

subplot 2 2 1
rotate 60 40:aspect 1 1 1
box:text 1 1 1.5 'rotate only' 'R'

subplot 2 2 2
rotate 60 40:aspect 1 1 2
box:text 0 0 2 'aspect and rotate'

subplot 2 2 3
rotate 60 40:aspect 1 2 2
box:text 0 0 1.5 'Aspect in other direction'
Here I used function text for printing the text in arbitrary position of picture, see section Text printing). Text coordinates and size are connected with axes. However, text coordinates may be everywhere, including the outside the bounding box. I shall show its features later in See section Text printing example.
Note that several commands can be placed in a string if they are separated by ‘:’ symbol.
Example of several subplots on the single picture.
| [ < ] | [ > ] | [ << ] | [ Up ] | [ >> ] | [Top] | [Contents] | [Index] | [ ? ] |
MathGL library can draw not only the bounding box but also the axes, grids, labels and so on. The limits of axes and their origin (the point of intersection) are determined by function axis. Also you can use xrange, yrange, zrange functions (see section Axis settings). Ticks on axis are specified by functions xtick, ytick, ztick, ttick. First argument the direction for each change will be applied. Second argument gives the step between ticks (if positive) or gives the number of ticks on the axis (if negative) or set to use logarithmic ticks (if zero). Third argument gives numbers of sub-ticks between ticks (default is zero). Last argument define the initial ticks position.
Function Axis draws axes. Its textual string shows in which directions the axis or axes will be drawn (by default 'xyz', function draws axes in all directions). Function Grid draws grid perpendicularly to specified directions. Example of axes and grid drawing is:
subplot 2 2 0
xtick 0.4 3     # sets tick step to 0.5
ytick 0.4 3     # and draws 3 subticks
box             # should be after the ticks change
axis 'xy': grid
text 0 1.3 1 'axis and grid'

xtick -5: ytick -5  # restore back
subplot 2 2 1:rotate 60 40
origin 0 0 0
axis
xlabel 'x' 1
ylabel 'y' 1
zlabel 'z' 1
text 0 0 1.5 'axis and labels'

subplot 2 2 2:rotate 60 40
xtick 0.2: ytick 0.2: ztick 0.2 # too low step of ticks
origin -1 -1 -1
axis:grid
text 0 0 1.5 'shift origin and add grid'
text 0 0 1.2 '(note, too many ticks)'

subplot 2 2 3:rotate 60 40
xtick -6: ytick -6  # decrease the number of ticks
axis 'yz'
ylabel 'y axis'
zlabel 'z axis'
text 0 0 1.5 'remove x axis, and'
text 0 0 1.2 'decrease number of ticks'
This example shows the importance of the correct choosing of the number of ticks on axis. If tick step is too small then its text may overlap and becomes unreadable. This code has the example of Label function. It draws label for axis in specified direction. The text position on axis is specified by third argument of Label function. If it is positive then then text is drawn near the axis maximum, if negative then the same takes place near the minimum of axis, if zero - then at the center of axis.

Example of setting up axis range and axis ticks.
| [ < ] | [ > ] | [ << ] | [ Up ] | [ >> ] | [Top] | [Contents] | [Index] | [ ? ] |
Now let use curvilinear coordinates. In difference from other systems of plot creation, MathGL uses textual formulas for connection of the old (data) and new (output) coordinates. This allows one to plot in arbitrary coordinates. The following code plots the line y=0, z=0 in Cartesian, polar, parabolic and spiral coordinates:
new x 50: new y 50: new z 50
fill y 0.5 0.5: fill x -1 1 # creates data arrays
origin -1 1 -1

subplot 2 2 0:rotate 60 40
plot x y z 'r2'
axis: grid
text 0 1.3 1 'cartesian'

subplot 2 2 1:rotate 60 40
axis 'y*sin(pi*x)' 'y*cos(pi*x)' ''
plot x y z 'r2'
axis: grid
text 0 1.3 1 'cylindrical'

subplot 2 2 2:rotate 60 40
axis '2*y*x' 'y*y - x*x' ''
plot x y z 'r2'
axis: grid
text 0 1.3 1 'parabolic'

subplot 2 2 3:rotate 60 40
axis 'y*sin(pi*x)' 'y*cos(pi*x)' 'x+z'
plot x y z 'r2'
axis: grid
text 0 1.3 1 'spiral'
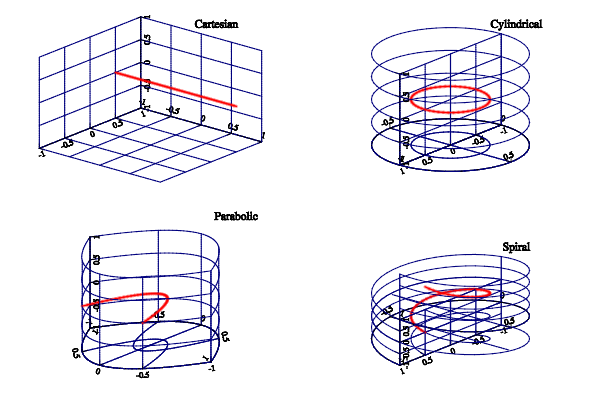
Example of curvilinear coordinates
| [ < ] | [ > ] | [ << ] | [ Up ] | [ >> ] | [Top] | [Contents] | [Index] | [ ? ] |
MathGL prints text by vector font. There are functions for manual specifying of text position (like Puts) and for its automatic selection (like Label, legend and so on). MathGL prints text always in specified position even if it lies outside the bounding box. The default size of font is specified by command fontsize. However, the actual size of output string depends on position of axes (depends on functions SubPlot, InPlot). The switching of the font style (italic, bold, wire and so on) can be done for the whole string (by function parameter) or inside the string. By default MathGL parses TeX-like commands for symbols and indexes (see see section Font styles). Example of MathGL font drawing is:
text 0 1 'Text can be in ASCII and in Unicode'
text 0 0.6 'It can be \wire{wire}, \big{big} or #r{colored}'
text 0 0.2 'One can change style in string: \b{bold}, \i{italic, \b{both}}'
text 0 -0.2 'Easy to \a{overline} or \u{underline}'
text 0 -0.6 'Easy to change indexes ^{up} _{down} @{center}'
text 0 -1 'It parse TeX: \int \alpha \cdot \sqrt3{sin(\pi x)^2 + \gamma_{i_k}} dx'
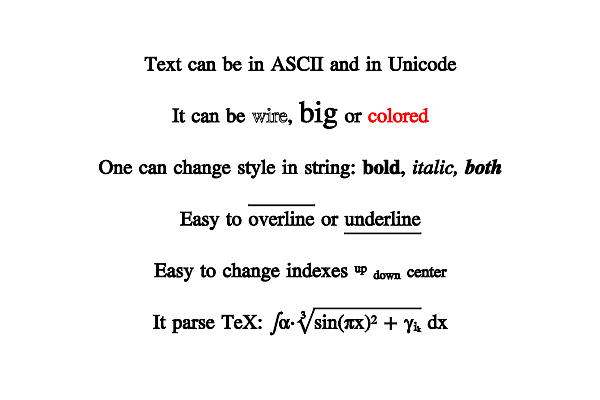
Example of text printing with different font effects
Another example demonstrate the features of TeX formula parsing.
text 0 0 '\sqrt{\frac{\alpha^{\gamma^2}+\overset 1{\big\infty}}{\sqrt3{2+b}}}', 0, -4
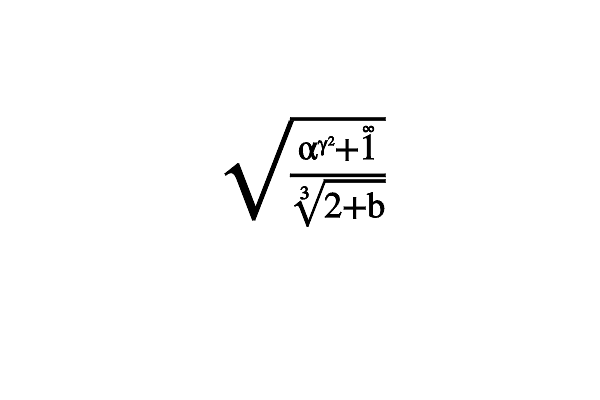
Example of TeX formula parsing
| [ < ] | [ > ] | [ << ] | [ Up ] | [ >> ] | [Top] | [Contents] | [Index] | [ ? ] |
| 2.3.1 Array creation | ||
| 2.3.2 Data changing |
| [ < ] | [ > ] | [ << ] | [ Up ] | [ >> ] | [Top] | [Contents] | [Index] | [ ? ] |
One can put numbers into the data instance by several ways. Let us do it for sinus function:
list command
list a 0 0.04 0.16 0.36 0.64 1
copy a [0,0.04,0.16,0.36,0.64,1]
modify function
new a 6
modify a 'x^2'
new a 6
fill a 0 1
modify a 'u^2'
new a 6
fill a '(x+1)^2/4'
new s 6: modify s 'x^2'
save s 'sqr.dat'    # create file first
read a 'sqr.dat'    # load it
new s 6: modify s 'x^2'
save s 'sqr.dat'    # create file first
read a 'sqr.dat' 5  # load it
Creation of 2d- and 3d-arrays is mostly the same. One can use direct data filling by list command
list a 11 12 13 | 21 22 23 | 31 32 33
or by inline arrays
copy a [[11,12,13],[21,22,23],[31,32,33]]
Also data can be filled by formula
new z 30 40
fill z 'sin(pi*x)*cos(pi*y)'
or loaded from file.
The only non-obvious thing here is using multidimensional arrays in C/C++, i.e. arrays defined like float dat[40][30];. Since, formaly this arrays element dat[i] can address the memory in arbitrary place you should use the proper function to convert such arrays to mglData object. For C++ this is functions like mglData::Set(float **dat, int N1, int N2. For C this is functions like mgl_data_set_float2(HMDT d, const float **dat, int N1, int N2. At this, you should keep in mind that nx=N2 and ny=N1 after conversion.
| [ < ] | [ > ] | [ << ] | [ Up ] | [ >> ] | [Top] | [Contents] | [Index] | [ ? ] |
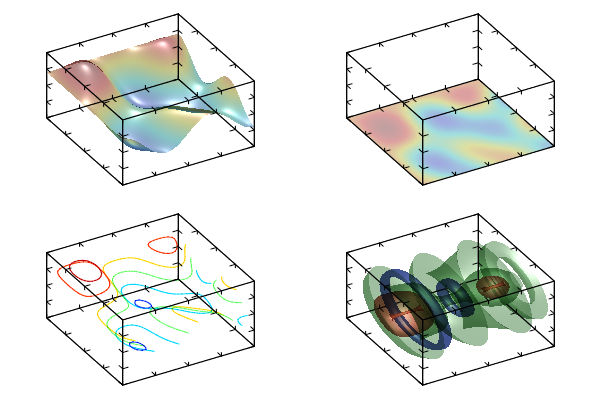
MathGL has functions for data processing: differentiating, integrating, smoothing and so on. Let us consider some examples. The simplest ones are integration and differentiation. The direction in which operation will be performed is specified by textual string, which may contain symbols ‘x’, ‘y’ or ‘z’. For example, the call of diff a 'x' will differentiate data along ‘x’ direction; the call of integrate a 'xy' perform the double integration of data along ‘x’ and ‘y’ directions; the call of diff2 a 'xyz' will apply 3d Laplace operator to data and so on. Example of this operations on 2d array a=x*y is presented in code:
new a 30 40: modify a 'x*y'
axis 0 0 0 1 1 1
subplot 2 2 0:rotate 60 40
surf a: box
text 0.7 1 1.2 'a(x,y)'
subplot 2 2 1:rotate 60 40
diff a 'x': surf a: box
text 0.7 1 1.2 'da/dx'
subplot 2 2 2:rotate 60 40
integrate a 'xy': surf a: box
text 0.7 1 1.2 '\int da/dx dxdy'
subplot 2 2 3:rotate 60 40
diff2 a 'y': surf a: box
text 0.7 1 1.2 '\int {d^2}a/dxdy dx'
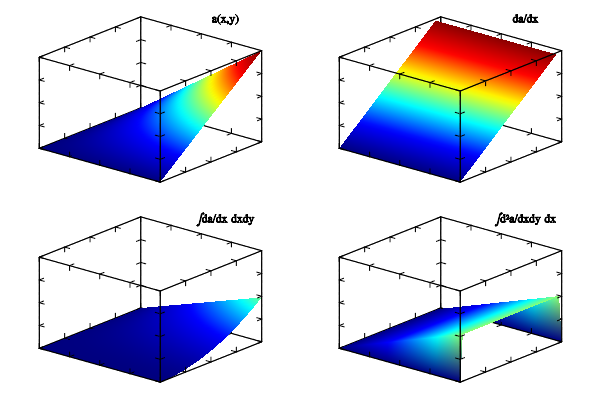
Example of data differentiation and integration
Data smoothing (function Smooth) is more interesting and important. This function has 2 main arguments: type of smoothing and its direction. Now 4 methods are supported: 0 does nothing for delta=0 or approaches data to zero with the step delta, 1 linear averaging by 3 points, 2 linear averaging by 5 points, 3 quadratic averaging by 5 points. Let me demonstrate it for 1d case:
new y0 30
modify y0 '0.4*sin(2*pi*x)+0.3*cos(3*pi*x)-0.4*sin(4*pi*x)+0.2*rnd'
copy y1 y0: smooth y1 1
copy y2 y0: smooth y2 2
copy y3 y0: smooth y3 3

plot y0 'k': addlegend 'none' 'k'
plot y1 'r': addlegend 'line 3' 'r'
plot y2 'g': addlegend 'line 5' 'g'
plot y3 'b': addlegend 'quad 5' 'b'
legend: box
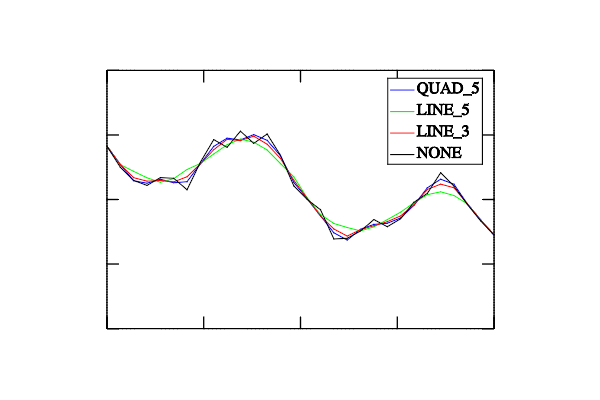
Example of data smoothing
Finally one can create new data arrays on base of the existing one: extract slice, row or column of data (SubData), summarize along some of direction(s) (Sum), find distribution of data elements (Hist). Note, that all these functions are not thread-safe because they use static internal variable for output array. In particular, the using of several of them in arguments of the same function will lead to unpredictable result.
| [ < ] | [ > ] | [ << ] | [ Up ] | [ >> ] | [Top] | [Contents] | [Index] | [ ? ] |
Let me now show how to plot the data. MathGL generally has 2 types of plotting functions. Simple variant requires a single data array for plotting, other data (coordinates) are considered uniformly distributed in interval Min*Max. Second variant requires data arrays for all coordinates. It allows one to plot rather complex multivalent curves and surfaces (in case of parametric dependencies). Argument setting to default values allows one to plot data in standard form. Manual arguments setting gives possibility for fine tuning of colors, positions and view of graphics. Note, that the call of drawing function adds something to picture but does not clear the previous plots (as it does in Matlab). Another difference from Matlab is that all setup (like transparency, lightning, axis borders and so on) must be specified before plotting functions.
| 2.4.1 Plots for 1D data | ||
| 2.4.2 Plots for 2D data | ||
| 2.4.3 Plots for 3D data | ||
| 2.4.4 Surface transparency |
| [ < ] | [ > ] | [ << ] | [ Up ] | [ >> ] | [Top] | [Contents] | [Index] | [ ? ] |
Term “1D data” means that data depend on single index (parameter) like curve in parametric form {x(i),y(i),z(i)}, i=1...n. There are 5 generally different types of data representations: simple line plot, line plot with filling under it, stairs plot, bar plot and vertical lines (see section 1D plotting). Each type of plotting has similar interface. There are 3D version and two 2D versions. One of last requires single array. The parameters of line and marks (see section Line styles) are specified by the string argument. If the string parameter is NULL then solid line with color from palette is used.
Below I shall show the features of 1D plotting on base of plot function (see section 1D plotting). Let us start from sinus plot:
new y0 50: modify y0 'sin(pi*(2*x-1))'
subplot 2 2 0
plot y0: box
Style of line is not specified in plot function. So MathGL uses the solid line with first color of palette (this is blue). Next subplot shows array y1 with 2 rows:
subplot 2 2 1
new y1 50 2
modify y1 'sin(pi*2*x-pi)'
modify y1 'cos(pi*2*x-pi)/2' 1
plot y1: box
As previously I did not specify the style of lines. As a result, MathGL again uses solid line with next colors in palette (there are green and red). Now let us plot a circle on the same subplot. The circle is parametric curve x=cos(\pi t), y=sin(\pi t). I will set the color of the circle (dark yellow, ‘Y’) and put marks ‘+’ at point position:
new x 50: modify x 'cos(pi*2*x-pi)'
plot x y0 'Y+'
Note that solid line is used because I did not specify the type of line. The same picture can be achieved by Plot2 function. Let us draw ellipse by orange dash line:
plot y1(:,0) y(:,1) 'q|'
Drawing in 3D space is mostly the same. Let us draw spiral with default line style. Now its color is 4-th color from palette (this is cyan):
subplot 2 2 2:rotate 60 40
new z 50: modify z '2*x-1'
plot x y0 z:box
Function Plot3 does 3D curve plot but for single array. Use it to put circle marks on the previous plot:
new y2 10 3:modify y2 'cos(pi*(2*x-1+y))'
modify y2 '2*x-1' 2
plot y2(:,0) y2(:,1) y2(:,2) 'bo '
Note that line style is empty ‘ ’ here. Usage of other 1D plotting functions looks similar:
subplot 2 2 3:rotate 60 40
bars x y0 z 'r':box

Example of 1D data plot
| [ < ] | [ > ] | [ << ] | [ Up ] | [ >> ] | [Top] | [Contents] | [Index] | [ ? ] |
Surfaces Surf and other 2D plots (see section 2D plotting) are drown the same simpler as 1D one. The difference is that the string parameter specifies not by line style but by the color scheme of the plot (see section Color scheme). Here I draw attention on 4 most interesting color schemes. There is gray scheme where color is changed from black to white (string ‘kw’) or from white to black (string ‘wk’). Another scheme is useful for accentuation of negative (by blue color) and positive (by red color) regions on plot (string ‘'BbwrR'’). Last one is the popular “jet” scheme (string ‘'BbcyrR'’).
Now I shall show the example of a surface drawing. At first let us switch lightning on
light on: light 0 0 0 1
and draw the surface, considering coordinates x,y to be uniformly distributed in interval Min*Max
new a0 50 40
modify a0 '0.6*sin(2*pi*x)*sin(3*pi*y)+0.4*cos(3*pi*(x*y))'
subplot 2 2 0:rotate 60 40
surf a0: box
Color scheme was not specified. So previous color scheme is used. In this case it is default color scheme (“jet”) for the first plot. Next example is a sphere. The sphere is parametrically specified surface:
new x 50 40: new y 50 40: new z 50 40
modify x '0.8*sin(2*pi*x)*sin(pi*y)'
modify y '0.8*cos(2*pi*x)*sin(pi*y)'
modify z '0.8*cos(pi*y)'
subplot 2 2 1:rotate 60 40
surf x y z 'bbwrr': box
I set color scheme to 'BbwrR' that corresponds to red top and blue bottom of the sphere.
Surfaces will be plotted for each of slice of the data if nz>1. Next example draws surfaces for data arrays with nz=3:
new a1 50 40 3
modify a1 '0.6*sin(2*pi*x)*sin(3*pi*y)+0.4*cos(3*pi*(x*y))'
modify a1 '0.6*cos(2*pi*x)*cos(3*pi*y)+0.4*sin(3*pi*(x*y))' 1
modify a1 '0.6*cos(2*pi*x)*cos(3*pi*y)+0.4*cos(3*pi*(x*y))' 2
subplot 2 2 2:rotate 60 40
alpha on
surf a1: box
Note, that it may entail a confusion. However, if one will use density plot then the picture will look better:
subplot 2 2 3: rotate 60 40
dens a1: box
Note, that the previous color scheme is used in last plots because there are no direct specification of the one.
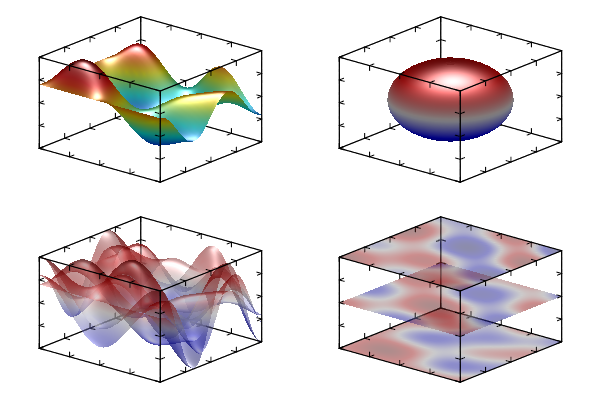
Example of surface plot for 2D data
Drawing of other 2D plots is analogous. The only peculiarity is the usage of flag ‘#’. By default this flag switches on the drawing of a grid on plot (grid or mesh for plots in plain or in volume). However, for isosurfaces (including surfaces of rotation axial) this flag switches the face drawing off. Figure becomes wired. The following code gives example of flag ‘#’ using (compare with normal function drawing as in its description):
alpha on: light on: light 0 0 0 1
new a 30 20
modify a '0.6*sin(2*pi*x)*sin(3*pi*y) + 0.4*cos(3*pi*(x*y))'

subplot 2 2 0: rotate 40 60
surf a 'bbcyrr#': box
subplot 2 2 1: rotate 40 60
dens a 'bbcyrr#': box
subplot 2 2 2: rotate 40 60
cont a 'bbcyrr#': box
subplot 2 2 3: rotate 40 60
axial a 'bbcyrr#': box
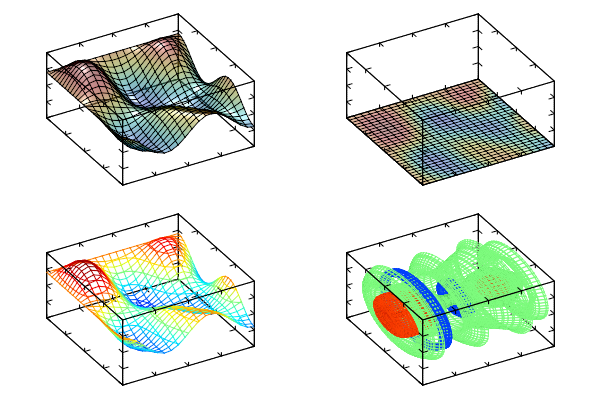
Example of 2D data plot with color scheme contained ‘#’ symbol
| [ < ] | [ > ] | [ << ] | [ Up ] | [ >> ] | [Top] | [Contents] | [Index] | [ ? ] |
Drawing procedures for 3D plot looks similarly to 1D and 2D plots described above. There are 3 general types of 3D plots (see section 3D plotting): (i) plots on slices or on projections, (ii) isosurfaces, (iii) cloud-like plots. Plots on slice are clear enough – one specifies a slice (as its index or as coordinate value) and MathGL draws contour lines or density plot on slice plane. Isosurface gives more information. Isosurface is 3D analogue of the contour line cont. It shows the region where data array values exceed specified isosurface level. Plot becomes more informative if one adds transparency, lightning or sets color scheme depending on coordinates. Generalization of isosurface is the cloud-like plot. For this plot the darker color and less transparent regions correspond to higher values of data. Contrary, the regions with low values are transparent. For plotting of the phase of fields (or beams or pulses) one can use isosurface which transparency depends on the other data array (see function surf3a). As example of 3D data plots let us draw the Gaussian beam diffraction in space. Beam propagates along x axis:
alpha on: light on
light 0 0 0 1
new a 30 30 30: new b 30 30 30
modify a 'exp(-16*((z-0.5)^2+(y-0.5)^2)/(1+4*x^2))'
modify b '16*((z-0.5)^2+(y-0.5)^2)*(x)/(1+4*x^2)'
caxis 0 1

subplot 2 2 0: rotate 40 60
surf3 a 'wgk': box
subplot 2 2 1: rotate 40 60
densa a: box: axis
subplot 2 2 2: rotate 40 60
cloud a: box
subplot 2 2 3: rotate 40 60
surf3a b a 'q': box
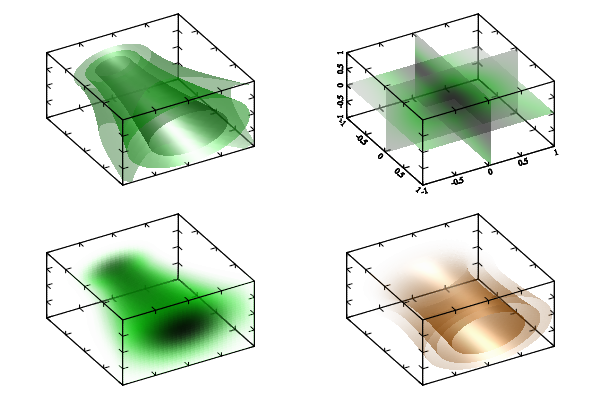
Example of Gaussian beam diffraction (3D data)
| [ < ] | [ > ] | [ << ] | [ Up ] | [ >> ] | [Top] | [Contents] | [Index] | [ ? ] |
MathGL library has advanced features for setting and handling the surface transparency. The simplest way to add transparency is the using of function Alpha. As a result, all further surfaces (and isosurfaces, density plots and so on) become transparent. However, their look can be additionally improved.
First, the selected surface will be non-transparent if one sets the flag transparent before the surface drawing and sets it off after the drawing.
Second, the value of transparency can be different from surface to surface. To do it just change the value of alphadef before the drawing of the selected surface. If its value is close to 0 then the surface becomes more and more transparent. Contrary, if its value is close to 1 then the surface becomes practically non-transparent. This is some analogue of transparent on.
Third feature is the changing of the way how the light goes through overlapped surfaces. The variable transptype defines it. By default the usual transparency is used (transptype 0) – surfaces below is less visible than the upper ones. A “glass-like” transparency (transptype 1) has a different look when the surface just decreases the background light (the surfaces are commutable in this case).
A “neon-like” transparency (transptype 2) has more interesting look. In this case a surface is the light source (like a lamp on the dark background) and just adds some intensity to the color. At this, the library sets automatically the black color for the background and changes the default line color to white.
As example I shall show the variant of plot from Plots for 2D data (grid drawing is disabled) for different types of transparency.

Example of TranspType=0.
Example of TranspType=1.

Example of TranspType=2.
| [ < ] | [ > ] | [ << ] | [ Up ] | [ >> ] | [Top] | [Contents] | [Index] | [ ? ] |
In this section I have included some small hints and advices for the improving of the quality of plots and for the demonstration of some non-trivial features of MathGL library. In contrast to previous examples I showed mostly the idea but not the whole drawing function. More examples with the source code can be find at http://mathgl.sf.net/ or in section Samples.
| [ < ] | [ > ] | [ << ] | [ Up ] | [ >> ] | [Top] | [Contents] | [Index] | [ ? ] |
As I noted above, MathGL functions (except the special one, like clf) do not erase the previous plotting but just add the new one. It allows one to draw “compound” plots easily. For example, popular Matlab command surfc can be emulated in MathGL by 2 calls:
surf a
cont a 0 7 -1   # draw contours at z = -1
Here a is 2-dimensional data for the plotting, -1 is the value of z-coordinate at which the contour should be plotted (at the bottom in this example). Analogously, one can draw density plot instead of contour lines and so on.
Another nice plot is contour lines plotted directly on the surface:
light on        # switch on light for the surface
surf a 'bbcyrr' # select 'jet' colormap for the surface
cont a 'y'      # and yellow color for contours
The possible difficulties arise in black&white case, when the color of the surface can be close to the color of a contour line. In that case I may suggest the following code:
light on        # switch on light for the surface
surf a 'kw'     # select 'gray' colormap for the surface
caxis -1 0      # first draw for darker surface colors
conta 'w'       # white contours
caxis 0 1       # now draw for brighter surface colors
cont a 'k'      # black contours
The idea is to divide the color range on 2 parts (dark and bright) and to select the contrasting color for contour lines for each of part.
Similarly, one can plot flow thread over density plot of vector field amplitude (this is another amusing plot from Matlab) and so on. The list of compound graphics can be prolonged but I hope that the general idea is clear.
| [ < ] | [ > ] | [ << ] | [ Up ] | [ >> ] | [Top] | [Contents] | [Index] | [ ? ] |
Developing the previous hint one can make a plot with 2 or more axes. The idea is that the change of settings does not influence on the already drawn graphics. So, for 2-axes plot let us set the first axis and draw everything concerning it. Then let us setup the second axis and draw things for the second axis. The corresponding code is (see section 2-axes sample):
# set up first axis
axis -1 -1 1 1: origin -1 -1
axis:fplot 'sin(pi*x)'      # draw something in first axis
# set up second axis
axis 0 0 1 1: origin 1 1
axis: fplot 'cos(4*pi*x^2)' # draw something in second axis
Note, that the first and the second axes look better if being placed in different corners. In the code presented above the first axis is placed in the left-bottom corner, and the second one is placed in the right-top corner.
| [ < ] | [ > ] | [ << ] | [ Up ] | [ >> ] | [Top] | [Contents] | [Index] | [ ? ] |
The printing of nice titles for the plot is not so trivial task in general case. The problem is that the rotation and aspect change lead to different looks for titles of different subplots. So, the resulting look is not so good as it could be. The solution is simple – to print titles exactly after subplot call and before any rotation, aspect change and so on! Analogously, the title for the whole picture looks better if it is printed first (before any subplot calls). Alternatively you can use function title for plotting title for the picture at any time.
| [ < ] | [ > ] | [ << ] | [ Up ] | [ >> ] | [Top] | [Contents] | [Index] | [ ? ] |
By default (for the user comfort), the color range is set equal to z-range of the plot. However, there are different ranges. So, one can obtain amusing plot by the change of color range manually. For example, there are plots with one-color bottom (or top) or practically bi-color picture and so on.
For example, compare 2 surfaces:
subplot 2 1 0
surf a          # usual coloring range
subplot 2 1 1
caxis 0 1
surf a          # bottom of the surface have one-colour filling
| [ < ] | [ > ] | [ << ] | [ Up ] | [ >> ] | [Top] | [Contents] | [Index] | [ ? ] |
Sometimes an experimental or numerical surface has outstanding points. Visualization of such surface will lead to the hole(s) in place of such points. The standard method of “fighting” – to change data values – is not always good and is not so convenient. MathGL library has another method – to set variable cut off. As a consequence, all outstanding points will be projected on the bounding box.
Such method is good not only for outstanding points but also for the case when one need to plane the bottom or the top of the plot. Exactly such case is demonstrated in the code:
new a 20 30     # create some data
modify a '0.6*sin(2*pi*x)*sin(3*pi*y) + 0.4*cos(3*pi*(x*y))'
# set lower border above the data minimal value
axis -1 -1 0 1 1 1:rotate 40 60
cut off         # set off cutting flag
surf a          # and draw the surface
It is an interesting result, is not it?
| [ < ] | [ > ] | [ << ] | [ Up ] | [ >> ] | [Top] | [Contents] | [Index] | [ ? ] |
Vector field visualization (especially in 3d case vect3 or vectc) may look tangly – there are too many overlapping lines. I may suggest 2 ways to solve this problem. The first one is to change meshnum for decreasing the number of hachures. The second way is to use the flow thread chart Flow. Unfortunately, I don’t know any other methods to visualize 3d vector field. If you know any, e-mail me and I shall add it to MatGL.
| [ < ] | [ > ] | [ << ] | [ Up ] | [ >> ] | [Top] | [Contents] | [Index] | [ ? ] |
In contrast to the most of other programs, MathGL supports several (up to 10) light sources. Moreover, the color each of them can be different: white (this is usual), yellow, red, cyan, green and so on. The use of several light sources may be interesting for the highlighting of some peculiarities of the plot or just to make an amusing picture. Note, each light source can be switched on/off individually (see section Several light sample).
| [ < ] | [ > ] | [ << ] | [ Up ] | [ >> ] | [Top] | [Contents] | [Index] | [ ? ] |
MathGL library has a feature for cutting of points in some region CutMin*CutMax. Such an excision can be used to improve the look of the graphics. Moreover, this cutting may help to show an internal structure of an object (like isocaps plot in Matlab). For example, let us use the standard 3D data array and show its interior (see section CutMinMax sample).
new c 61 51 40      # create the data
new v 10: fill v -0.5 1
modify c '(-2*((2*x-1)^2 + (2*y-1)^2 + (2*z-1)^4 - (2*z-1)^2 - 0.1))'
cut 0 -1 -1 1 0 1.1
rotate 40 60:       surf3 c -0.5 'bbcyrr'
contf3 v c 'x' -1 'bbcyrr': contf3 v c 'y' -1 'bbcyrr'
contf3 v c 'z' 0 'bbcyrr':  contf3 v c 'z' 39 'bbcyrr'
One can also exclude points from arbitrary area in space. This area defined by textual formula cut (see section Cutting). The algorithm is the same as shown for “rectangular cutting”.
| [ < ] | [ > ] | [ << ] | [ Up ] | [ >> ] | [Top] | [Contents] | [Index] | [ ? ] |
Sometime ago I worked with mapping and have a question about its visualization. Let me remember you that mapping is some transformation rule for one set of number to another one. The 1d mapping is just an ordinary function – it takes a number and transforms it to another one. The 2d mapping (which I used) is a pair of functions which take 2 numbers and transform them to another 2 ones. Except general plots (like surfc, surfa) there is a special plot – Arnold diagram. It shows the area which is the result of mapping of some initial area (usually square).
I tried to make such plot in map. It shows the set of points or set of faces, which final position is the result of mapping. At this, the color gives information about their initial position and the height describes Jacobian value of the transformation. Unfortunately, it looks good only for the simplest mapping but for the real multivalent quasi-chaotic mapping it produces a confusion. So, use it if you like :).
| [ < ] | [ > ] | [ << ] | [ Up ] | [ >> ] | [Top] | [Contents] | [Index] | [ ? ] |
Log-scaled plot can be drawn by 2 steps. First, one should change the scale of axis by call axis 'lg(x)' 'lg(y)' (in this example, x- and y-axis will be log-scaled). Second, one should set logarithmic scale for axis ticks by changing variables: xtick 0: yticks 0. Finally, one should check (or change) the axis ranges and origin so that their values to be positive. For example of log-log plot see section Log-log sample.
| [ < ] | [ > ] | [ << ] | [ Up ] | [ >> ] | [Top] | [Contents] | [Index] | [ ? ] |
Nonlinear fitting is rather simple. All that you need is the data to fit, the approximation formula and the list of coefficients to fit (better with its initial guess values). Let me demonstrate it on the following simple example (see section Fitting sample). First, let us use sin function with some random noise:
new rnd 100: new idl 50 # data to be fitted and ideal data
modify rnd '0.4*rnd+0.1+sin(4*pi*x)'
modify idl '0.3+sin(4*pi*x)'
and plot it to see that data we will fit
axis -1 -2 1 2
plot rnd '. ':plot idl 'b'
box:text 0 2.2 'initial: y = 0.3+sin(2\pi x)' 'C:b' -1
The next step is the fitting itself. For that let me specify an initial values ini for coefficients ‘abc’ and do the fitting for approximation formula ‘a+b*sin(c*x)’
new res     # The data for found formula
fit res rnd 'a+b*sin(c*x)' 'abc' [1, 1, 3]
Now display it
plot res 'r'
text -1 -1.3 'fitted:' 'L:r' -1
putsfit 0 -1.8 'y = ' 'C:r' -1
NOTE! the fitting results may have strong dependence on initial values for coefficients due to algorithm features. The problem is that in general case there are several local ’optimums’ for coefficients and the program returns only first found one! There are no guaranties that it will be the best. Try for example to set ini = [0, 0, 0] in the code above.
| [ < ] | [ > ] | [ << ] | [ Up ] | [ >> ] | [Top] | [Contents] | [Index] | [ ? ] |
Solving of Partial Differential Equations (PDE, including beam tracing) and ray tracing (or finding particle trajectory) are more or less common task. So, MathGL have several functions for that. There are ray for ray tracing, pde for PDE solving, qo2d for beam tracing in 2D case. Note, that these functions take “Hamiltonian” or equations as string values. And I don’t plan now to allow one to use user-defined functions. There are 2 reasons: the complexity of corresponding interface; and the basic nature of used methods which are good for samples but may not good for serious scientific calculations.
The ray tracing can be done by ray function. Really ray tracing equation is Hamiltonian equation for 3D space. So, the function can be also used for finding a particle trajectory (i.e. solve Hamiltonian ODE) for 1D, 2D or 3D cases. The function have a set of arguments. First of all, it is Hamiltonian which defined the media (or the equation) you are planning to use. The Hamiltonian is defined by string which may depend on coordinates ‘x’, ‘y’, ‘z’, time ‘t’ (for particle dynamics) and momentums ‘p’=p_x, ‘q’=p_y, ‘v’=p_z. Next, you have to define the initial conditions for coordinates and momentums at ‘t’=0 and set the integrations step (default is 0.1) and its duration (default is 10). The Runge-Kutta method of 4-th order is used for integration.
new re 128:new im 128
ray r 'p^2+q^2-x-1' -0.7 -1 0 0 0.5 0
plot r(0) r(1)
This example calculate the reflection from linear layer (media with Hamiltonian ‘p^2+q^2-x-1’=p_x^2+p_y^2-x-1). This is parabolic curve. The resulting array have 7 columns which contain data for {x,y,z,p,q,v,t}.
The solution of PDE is a bit more complicated. As previous you have to specify the equation as pseudo-differential operator \hat H(x, \nabla) which is called sometime as “Hamiltonian” (for example, in beam tracing). As previously, it is defined by string which may depend on coordinates ‘x’, ‘y’, ‘z’ (but not time!), momentums ‘p’=(d/dx)/i k_0, ‘q’=(d/dy)/i k_0 and field amplitude ‘u’=|u|. The evolutionary coordinate is ‘z’ in all cases. So that, the equation look like du/dz = ik_0 H(x,y,\hat p, \hat q, |u|)[u]. Dependence on field amplitude ‘u’=|u| allows one to solve nonlinear problems too. For example, for nonlinear Shrodinger equation you may set ham='p^2 + q^2 - u^2'. Also you may specify imaginary part for wave absorption, like ham = 'p^2 + i*x*(x>0)', but only if dependence on variable ‘i’ is linear (i.e. H = Hre+i*Him).
Next step is specifing the initial conditions at ‘z’=Min.z. The function need 2 arrays for real and for imaginary part. Note, that coordinates x,y,z are supposed to be in specified range [Min, Max]. So, the data arrays should have corresponding scales. Finally, you may set the integration step and paramter k0=k_0. Also keep in mind, that internally the 2 times large box is used (for suppressing numerical reflection from boundaries) and the equation should well defined even in this extended range.
Final comment is concerning the possible form of pseudo-differential operator H. At this moment, simplified form of operator H is supported – all “mixed” terms (like ‘x*p’->x*d/dx) are excluded. For example, in 2D case this operator is effectively H = f(p,z) + g(x,z,u). However commutable combinations (like ‘x*q’->x*d/dy) are allowed for 3D case.
So, for example let solve the equation for beam deflected from linear layer and absorbed later. The operator will have the form ‘'p^2+q^2-x-1+i*0.5*(z+x)*(z>-x)'’ that correspond to equation ik_0 \partial_z u + \Delta u + x \cdot u + i (x+z)/2 \cdot u = 0. This is typical equation for Electron Cyclotron (EC) absorption in magnetized plasmas. For initial conditions let me select the beam with plane phase front exp(-48*(x+0.7)^2). The corresponding code looks like this (see section PDE sample):
new re 128: new im 128
fill re 'exp(-48*(x+0.7)^2)'
pde a 'p^2+q^2-x-1+i*0.5*(z+x)*(z>-x)' re im 0.01, 30
transpose a 'yxz'
caxis 0 1
dens a 'wyrRk'
The last example is example of beam tracing. Beam tracing equation is special kind of PDE equation written in coordinates accompanied to a ray. Generally this is the same parameters and limitation as for PDE solving but the coordinates are defined by the ray and by parameter of grid width w in direction transverse the ray. So, you don’t need to specify the range of coordinates. BUT there is limitation. The accompanied coordinates are well defined only for smooth enough rays, i.e. then the ray curvature K (which is defined as 1/K^2 = (|\ddot r|^2 |\dot r|^2 - (\ddot r, \dot r)^2)/|\dot r|^6) is much large then the grid width: K>>w. So, you may receive incorrect results if this condition will be broken.
You may use following code for obtaining the same solution as in previous example:
new re 128: new im 128
define $1 'p^2+q^2-x-1+i*0.5*(y+x)*(y>-x)'
ray r $1 -0.7 -1 0 0 0.5 0 0.02 2
# now start beam tracing
fill re 'exp(-48*x^2)'
new xx: new yy
qo2d a $1 re im r 1 30 xx yy
caxis 0 1
dens xx yy a 'wyrRk'
| [ < ] | [ > ] | [ << ] | [ Up ] | [ >> ] | [Top] | [Contents] | [Index] | [ ? ] |
One can easily create stereo image in MathGL. Stereo image can be produced by making two subplots with slightly different rotation angles. The corresponding code looks like this (see section Stereo image sample):
subplot 2 1 0   # left image
rotate 40 60+3
# draw something here
subplot 2 1 1   # right image
rotate 40 60-3
# draw the same here
| [ << ] | [ >> ] | [Top] | [Contents] | [Index] | [ ? ] |
This document was generated by Alexey Balakin on May 31, 2011 using texi2html 1.82.