3. Samples
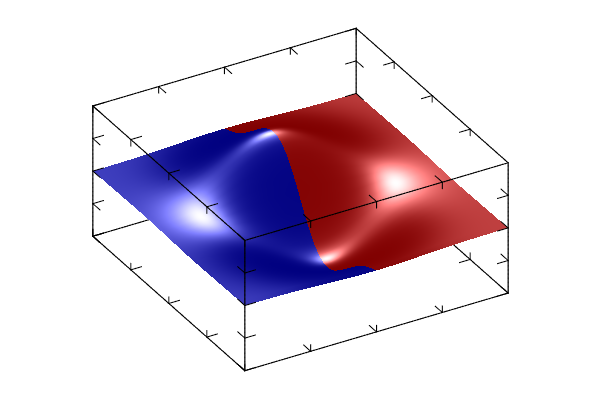
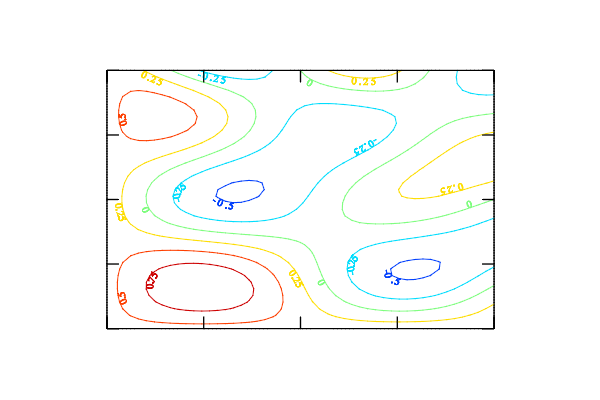
This chapter contain a lot of sample codes for all types of plots and for most important examples and hints. The same sample (with pictures) you can find at http://mathgl.sf.net/pictures.html.
3.1 1D plotting samples
3.1.1 Plot sample
new y 50 3
modify y '0.7*sin(2*pi*x) + 0.5*cos(3*pi*x) + 0.2*sin(pi*x)'
modify y 'sin(2*pi*x)' 1
modify y 'cos(2*pi*x)' 2
box
plot y
3.1.2 Radar sample
new y 10 3
modify y '0.4*sin(pi*(2*x+y/2))+0.1*rnd'
radar y '#'
3.1.3 Tens sample
new y 50
new c 50
modify y '0.7*sin(2*pi*x) + 0.5*cos(3*pi*x) + 0.2*sin(pi*x)'
modify c 'sin(2*pi*x)'
box
tens y c
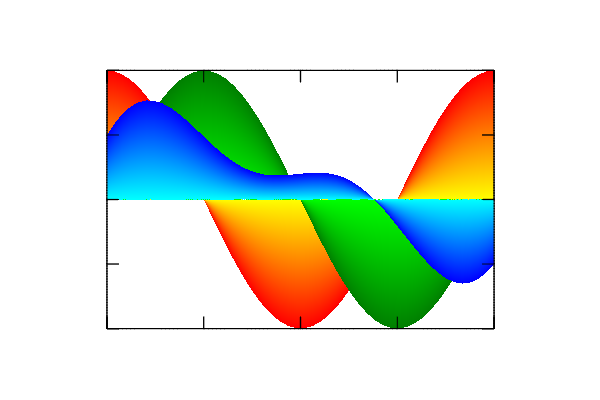
3.1.4 Area sample
new y 50 3
modify y '0.7*sin(2*pi*x) + 0.5*cos(3*pi*x) + 0.2*sin(pi*x)'
modify y 'sin(2*pi*x)' 1
modify y 'cos(2*pi*x)' 2
origin 0 0
box
area y
3.1.5 Area with gradient filling sample
new y 50 3
modify y '0.7*sin(2*pi*x) + 0.5*cos(3*pi*x) + 0.2*sin(pi*x)'
modify y 'sin(2*pi*x)' 1
modify y 'cos(2*pi*x)' 2
origin 0 0
box
area y 'cbgGyr'
3.1.6 Bars sample
new y 10 3
modify y '0.8*sin(pi*(2*x+y/2))+0.2*rnd'
origin 0 0
box
bars y
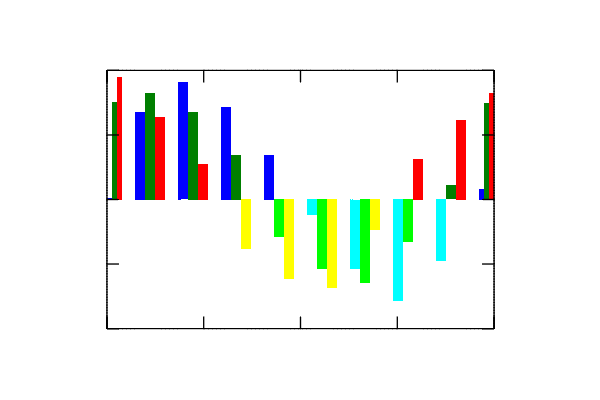
3.1.7 Bars 2 colors sample
new y 10 3
modify y '0.8*sin(pi*(2*x+y/2))+0.2*rnd'
origin 0 0
box
bars y 'cbgGyr'
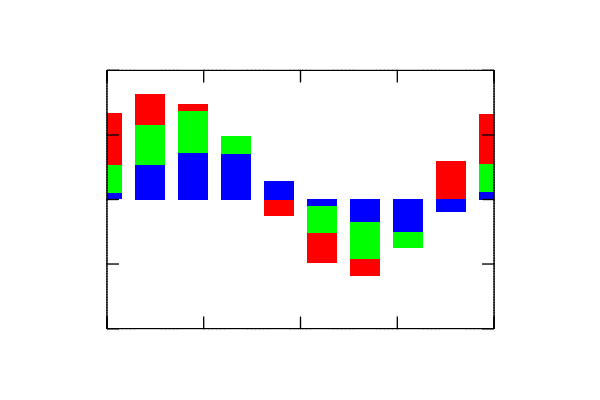
3.1.8 Bars above sample
new y 10 3
modify y '0.8*sin(pi*(2*x+y/2))+0.2*rnd'
origin 0 0
box
bars y 'a'
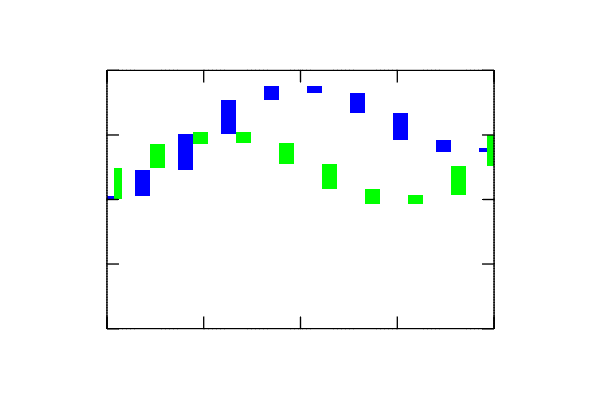
3.1.9 Bars fall sample
new y 10 3
modify y '0.8*sin(pi*(2*x+y/2))+0.2*rnd'
origin 0 0
box
bars y 'f'
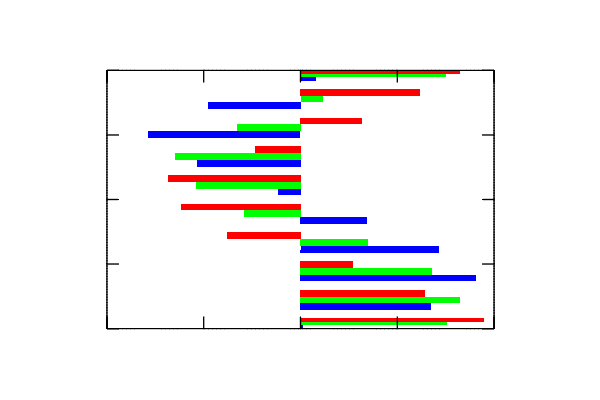
3.1.10 Barh sample
new y 10 3
modify y '0.8*sin(pi*(2*x+y/2))+0.2*rnd'
origin 0 0
box
barh y
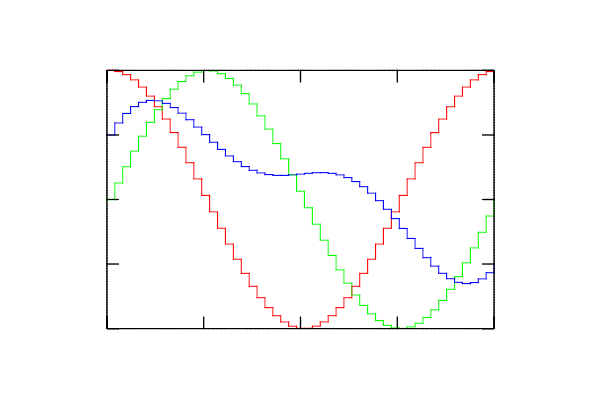
3.1.11 Step sample
new y 50 3
modify y '0.7*sin(2*pi*x) + 0.5*cos(3*pi*x) + 0.2*sin(pi*x)'
modify y 'sin(2*pi*x)' 1
modify y 'cos(2*pi*x)' 2
box
step y
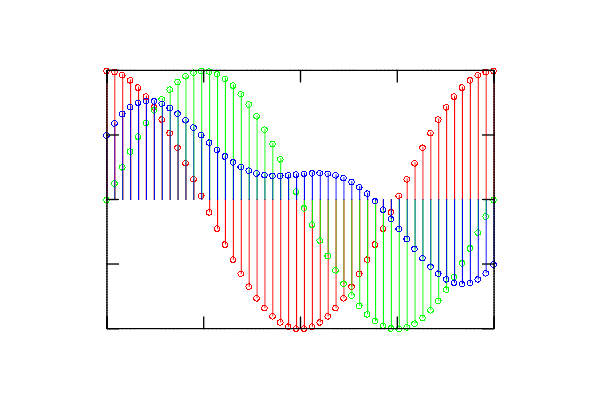
3.1.12 Stem sample
new y 50 3
modify y '0.7*sin(2*pi*x) + 0.5*cos(3*pi*x) + 0.2*sin(pi*x)'
modify y 'sin(2*pi*x)' 1
modify y 'cos(2*pi*x)' 2
origin 0 0
box
stem y 'o'
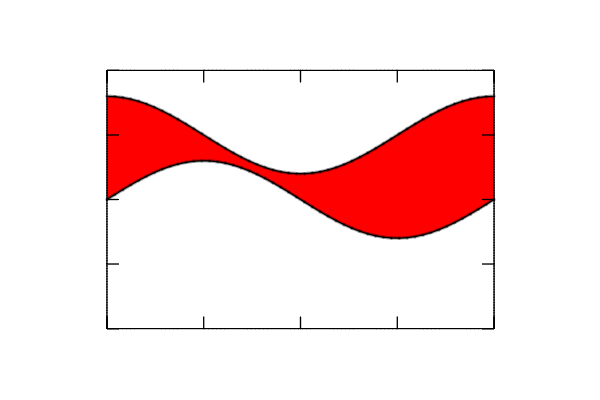
3.1.13 Region sample
new y1 50
new y2 50
modify y1 '0.3*sin(2*pi*x)'
modify y2 '0.5+0.3*cos(2*pi*x)'
box
region y1 y2 'r'
plot y1 'k2'
plot y2 'k2'
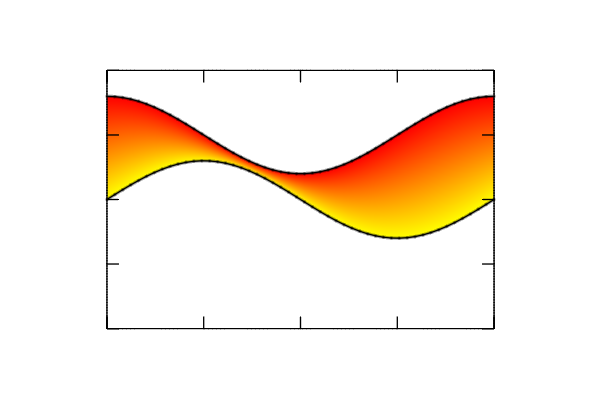
3.1.14 Region gradient sample
new y1 50
new y2 50
modify y1 '0.3*sin(2*pi*x)'
modify y2 '0.5+0.3*cos(2*pi*x)'
box
region y1 y2 'yr'
plot y1 'k2'
plot y2 'k2'
3.1.15 Error sample
new y 50
new x0 10
new y0 10
new ex 10
new ey 10
modify y '0.7*sin(2*pi*x) + 0.5*cos(3*pi*x) + 0.2*sin(pi*x)'
modify x0 '2*x-1 + 0.1*rnd-0.05'
modify y0 '0.7*sin(2*pi*x) + 0.5*cos(3*pi*x) + 0.2*sin(pi*x) + 0.2*rnd-0.1'
modify ey '0.2'
modify ex '0.1'
box
plot y
error x0 y0 ex ey 'ko'
3.1.16 BoxPlot sample
new a 10 7
modify a '(2*rnd-1)^3/2'
boxplot a
box:plot a ' ko'
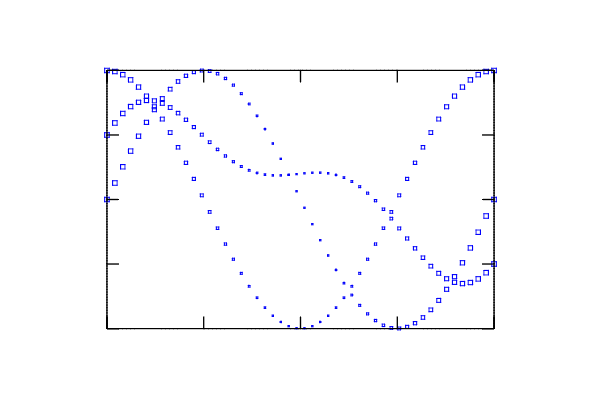
3.1.17 Mark sample
new y 50 3
modify y '0.7*sin(2*pi*x) + 0.5*cos(3*pi*x) + 0.2*sin(pi*x)'
modify y 'sin(2*pi*x)' 1
modify y 'cos(2*pi*x)' 2
new y1 50
modify y1 '0.5+0.3*cos(2*pi*x)'
box
mark y y1 'bs'
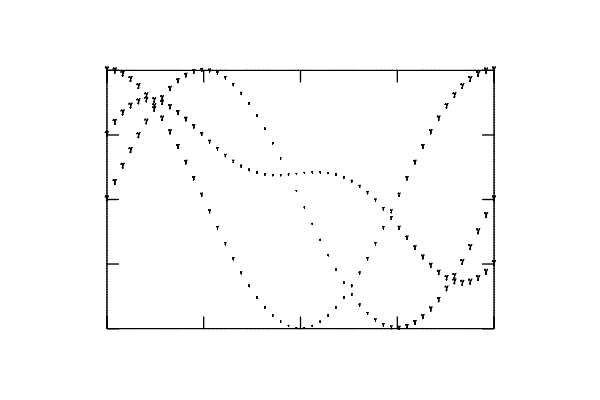
3.1.18 TextMark sample
new y 50 3
modify y '0.7*sin(2*pi*x) + 0.5*cos(3*pi*x) + 0.2*sin(pi*x)'
modify y 'sin(2*pi*x)' 1
modify y 'cos(2*pi*x)' 2
new y1 50
modify y1 '0.5+0.3*cos(2*pi*x)'
box
textmark y y1 '\gamma'
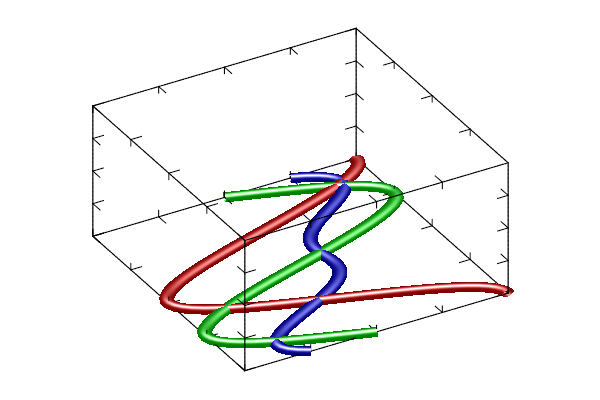
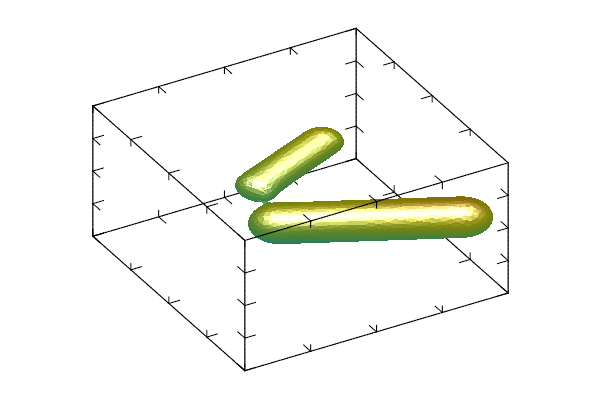
3.1.19 Tube sample
new y 50 3
modify y '0.7*sin(2*pi*x) + 0.5*cos(3*pi*x) + 0.2*sin(pi*x)'
modify y 'sin(2*pi*x)' 1
modify y 'cos(2*pi*x)' 2
rotate 40 60
light on
box
tube y 0.05
3.1.20 Text sample
new y 50 3
modify y '0.7*sin(2*pi*x) + 0.5*cos(3*pi*x) + 0.2*sin(pi*x)'
modify y 'sin(2*pi*x)' 1
modify y 'cos(2*pi*x)' 2
box
plot y(:,0)
text y 'This is very long string drawn along a curve' ':k'
text y 'Another string drawn above a curve' 'T:r'
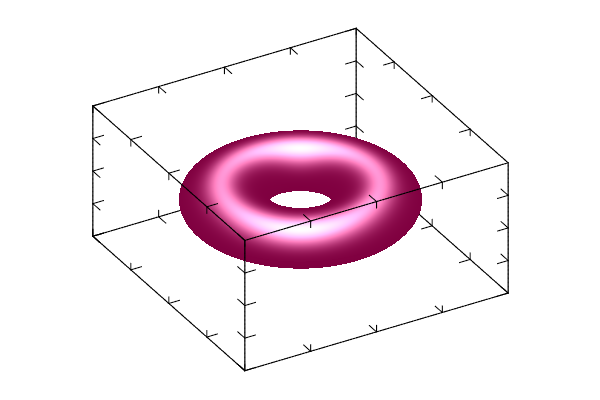
3.1.21 Torus sample
new y1 50
new y2 50
modify y1 '0.5+0.3*cos(2*pi*x)'
modify y2 '0.3*sin(2*pi*x)'
rotate 40 60
light on
box
torus y1 y2 'pz'
3.1.22 Chart sample
new ch 7 2
modify ch 'rnd+0.1'
rotate 40 60
light on
box
chart ch
3.1.23 Pie chart sample
new ch 7 2
modify ch 'rnd+0.1'
rotate 40 60
light on
axis '(y+1)/2*cos(pi*x)' '(y+1)/2*sin(pi*x)' ''
box
chart ch 'bgr cmy#'
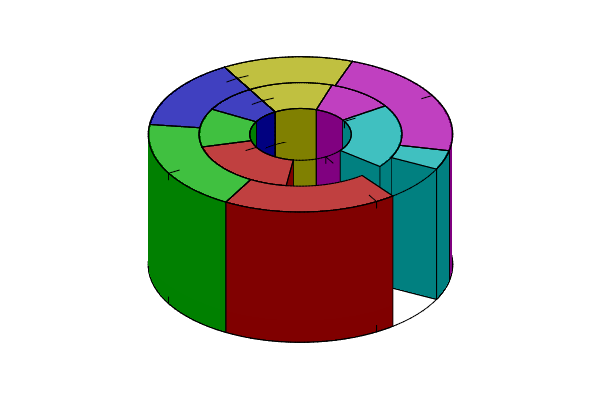
3.1.24 Ring chart sample
new ch 7 2
modify ch 'rnd+0.1'
rotate 40 60
light on
axis '(y+2)/3*cos(pi*x)' '(y+2)/3*sin(pi*x)' ''
box
chart ch 'bgr cmy#'
3.2 2D plotting samples
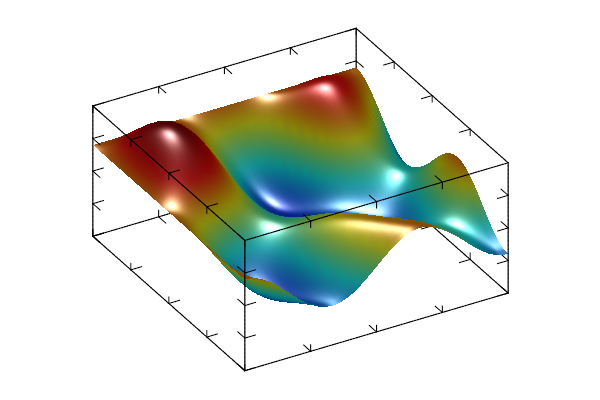
3.2.1 Surf sample
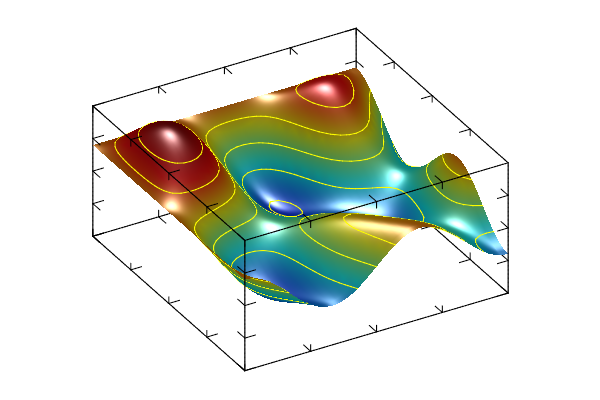
new a 50 40
modify a '0.6*sin(2*pi*x)*sin(3*pi*y) + 0.4*cos(3*pi*(x*y))'
rotate 40 60
light on
box
surf a
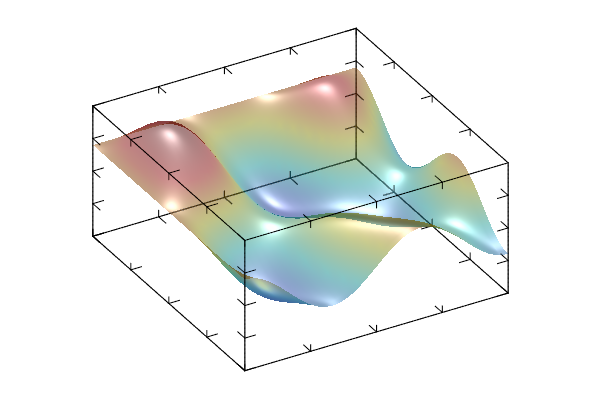
3.2.2 Transparent surface sample
new a 50 40
modify a '0.6*sin(2*pi*x)*sin(3*pi*y) + 0.4*cos(3*pi*(x*y))'
rotate 40 60
light on
alpha on
box
surf a
3.2.3 Surface in fog sample
new a 50 40
modify a '0.6*sin(2*pi*x)*sin(3*pi*y) + 0.4*cos(3*pi*(x*y))'
rotate 40 60
light on
fog 1
box
surf a
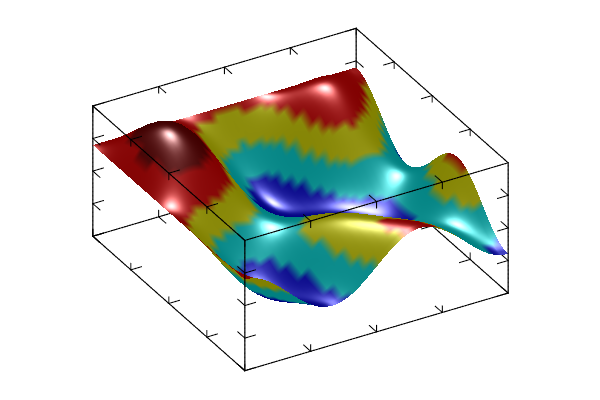
3.2.4 Sharp colors sample
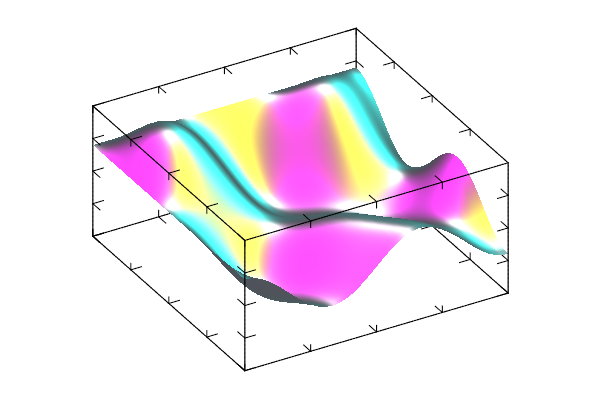
new a 50 40
modify a '0.6*sin(2*pi*x)*sin(3*pi*y) + 0.4*cos(3*pi*(x*y))'
rotate 40 60
light on
box
surf a 'BbcyrR|'
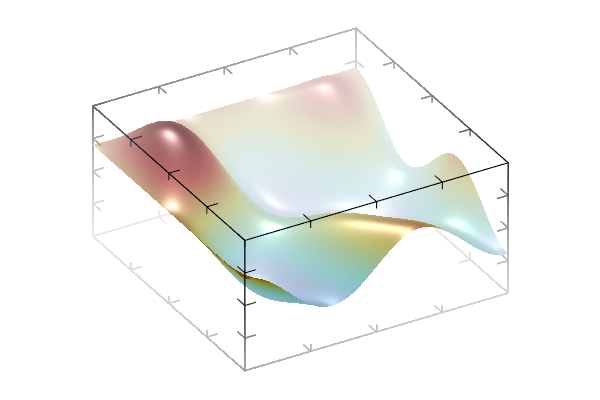
3.2.5 Mesh sample
new a 50 40
modify a '0.6*sin(2*pi*x)*sin(3*pi*y) + 0.4*cos(3*pi*(x*y))'
rotate 40 60
box
mesh a
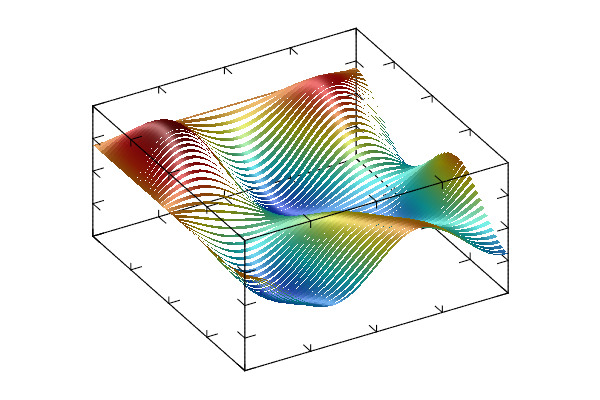
3.2.6 Fall sample
new a 50 40
modify a '0.6*sin(2*pi*x)*sin(3*pi*y) + 0.4*cos(3*pi*(x*y))'
rotate 40 60
box
fall a
3.2.7 Belt sample
new a 50 40
modify a '0.6*sin(2*pi*x)*sin(3*pi*y) + 0.4*cos(3*pi*(x*y))'
rotate 40 60
light on
box
belt a
3.2.8 Tile sample
new a 50 40
modify a '0.6*sin(2*pi*x)*sin(3*pi*y) + 0.4*cos(3*pi*(x*y))'
rotate 40 60
light on
box
tile a
3.2.9 Boxs sample
new a 50 40
modify a '0.6*sin(2*pi*x)*sin(3*pi*y) + 0.4*cos(3*pi*(x*y))'
rotate 40 60
light on
origin 0 0 0
box
boxs a
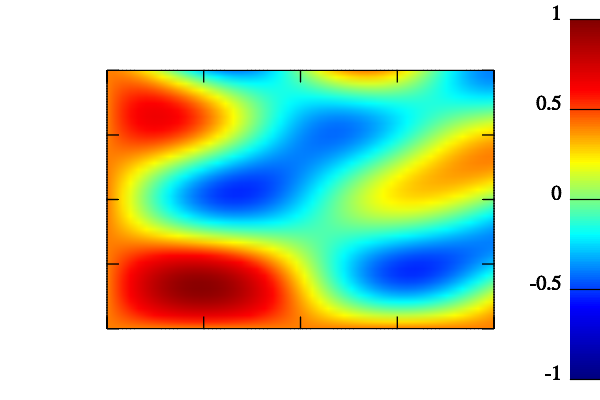
3.2.10 Dens sample
new a 50 40
modify a '0.6*sin(2*pi*x)*sin(3*pi*y) + 0.4*cos(3*pi*(x*y))'
box
dens a
colorbar
3.2.11 Cont sample
new a 50 40
modify a '0.6*sin(2*pi*x)*sin(3*pi*y) + 0.4*cos(3*pi*(x*y))'
rotate 40 60
box
cont a
3.2.12 ContF sample
new a 50 40
modify a '0.6*sin(2*pi*x)*sin(3*pi*y) + 0.4*cos(3*pi*(x*y))'
rotate 40 60
light on
box
contf a
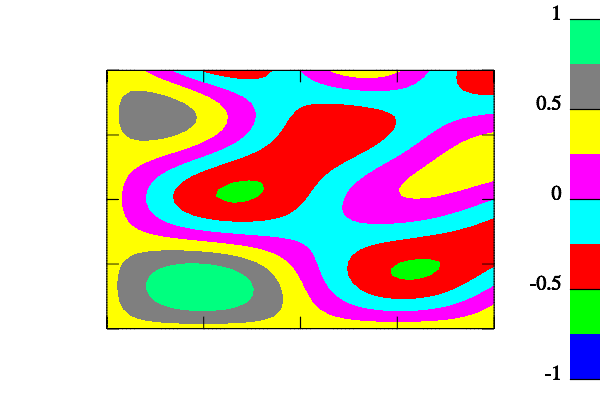
3.2.13 ContD sample
new a 50 40
modify a '0.6*sin(2*pi*x)*sin(3*pi*y) + 0.4*cos(3*pi*(x*y))'
var v 9 -1 1
box
contd v a
colorbar v
3.2.14 Axial sample
new a 50 40
modify a '0.6*sin(2*pi*x)*sin(3*pi*y) + 0.4*cos(3*pi*(x*y))'
rotate 40 60
light on
alpha on
box
axial a
3.2.15 Grad sample
new a 50 40
modify a '0.6*sin(2*pi*x)*sin(3*pi*y) + 0.4*cos(3*pi*(x*y))'
box:alpha on:dens a
grad a
3.3 3D plotting samples
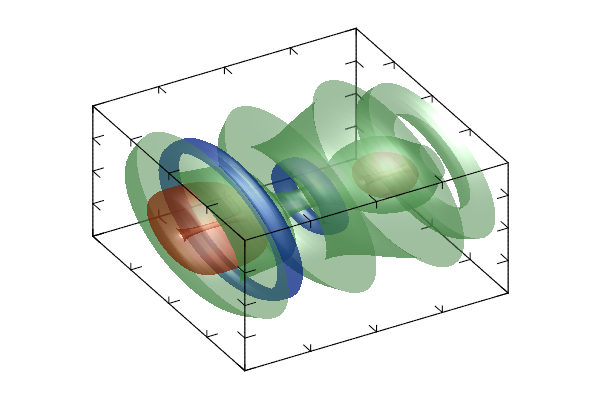
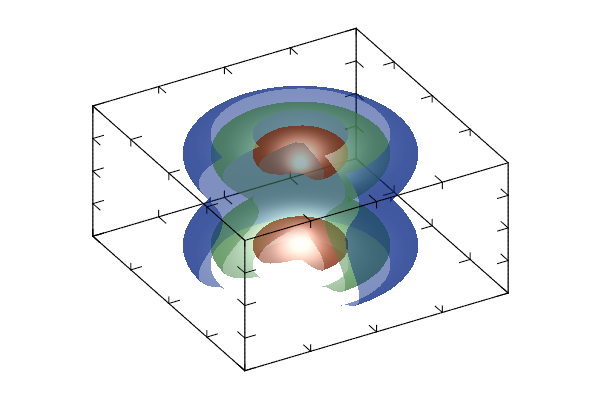
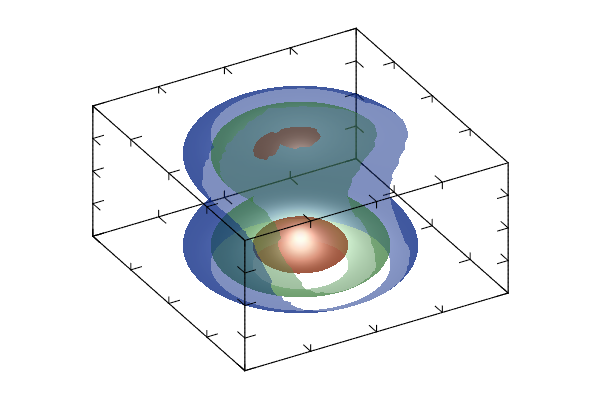
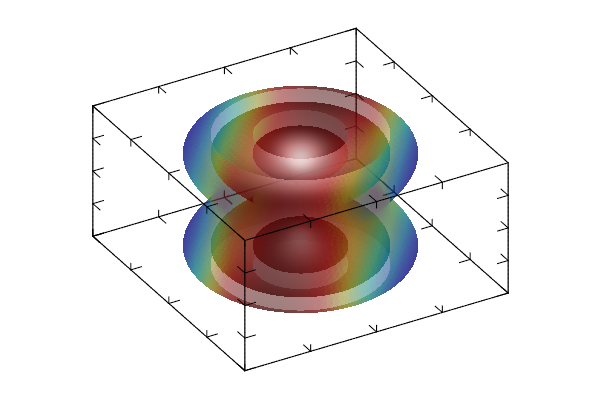
3.3.1 Surf3 sample
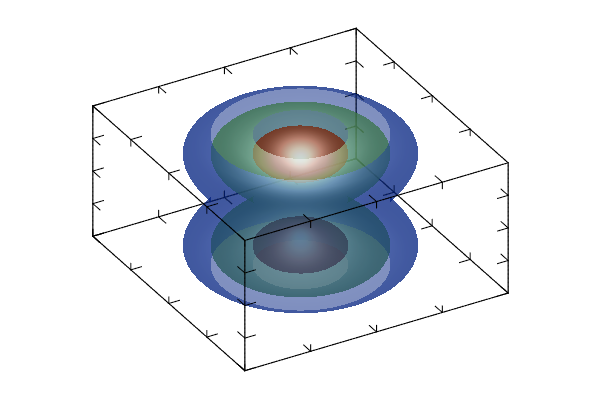
new a 60 50 40
modify a '-2*((2*x-1)^2 + (2*y-1)^2 + (2*z-1)^4 - (2*z-1)^2 - 0.1)'
rotate 40 60
light on
alpha on
box
surf3 a
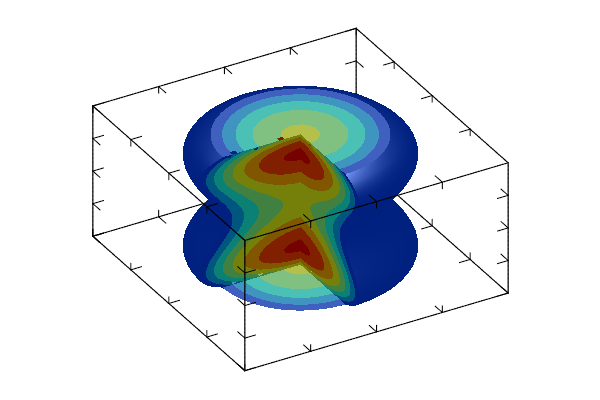
3.3.2 Cloud sample
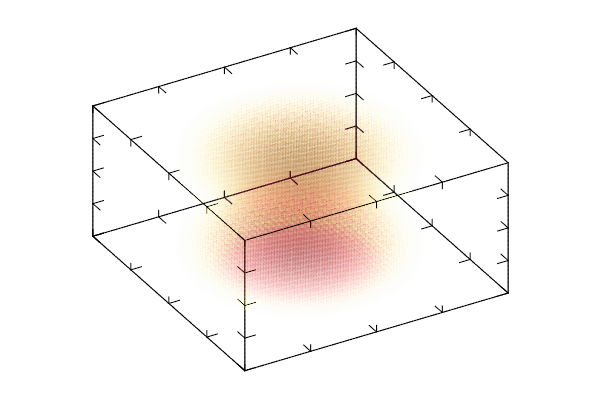
new a 60 50 40
modify a '-2*((2*x-1)^2 + (2*y-1)^2 + (2*z-1)^4 - (2*z-1)^2 - 0.1)'
rotate 40 60
alpha on
box
cloud a 'wyrRk'
3.3.3 CloudP sample
Not available.
3.3.4 Dens3 sample
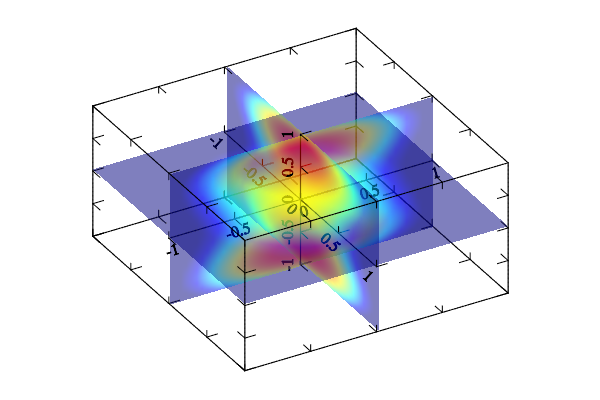
new a 60 50 40
modify a '-2*((2*x-1)^2 + (2*y-1)^2 + (2*z-1)^4 - (2*z-1)^2 - 0.1)'
rotate 40 60
alpha on
origin 0 0 0
box
densa a
axis
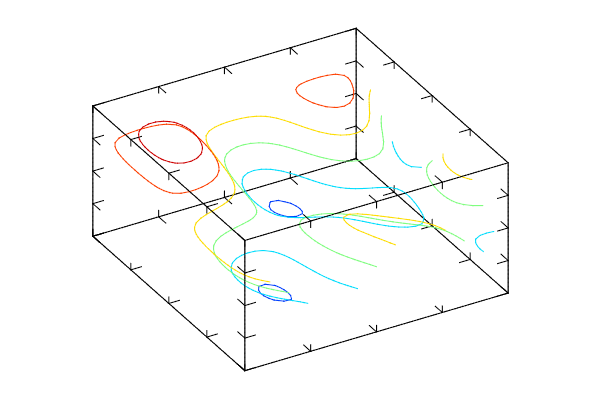
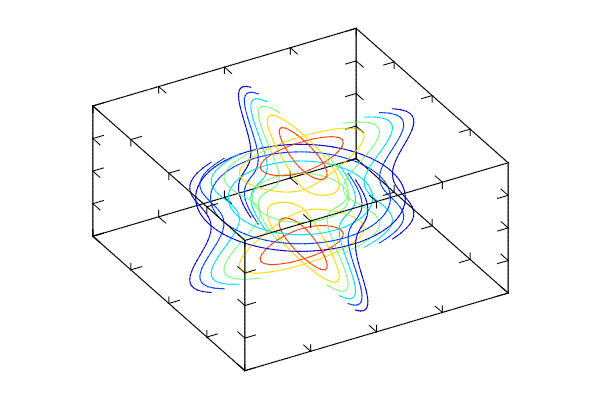
3.3.5 Cont3 sample
new a 60 50 40
modify a '-2*((2*x-1)^2 + (2*y-1)^2 + (2*z-1)^4 - (2*z-1)^2 - 0.1)'
rotate 40 60
box
conta a
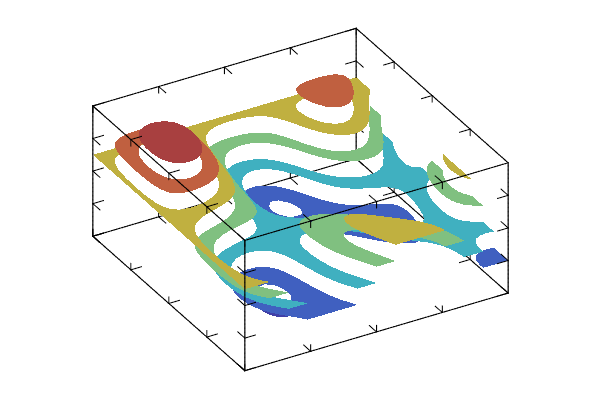
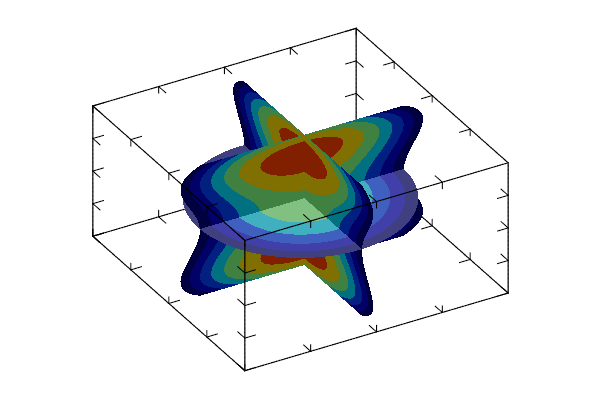
3.3.6 ContF3 sample
new a 60 50 40
modify a '-2*((2*x-1)^2 + (2*y-1)^2 + (2*z-1)^4 - (2*z-1)^2 - 0.1)'
rotate 40 60
light on
box
contfa a
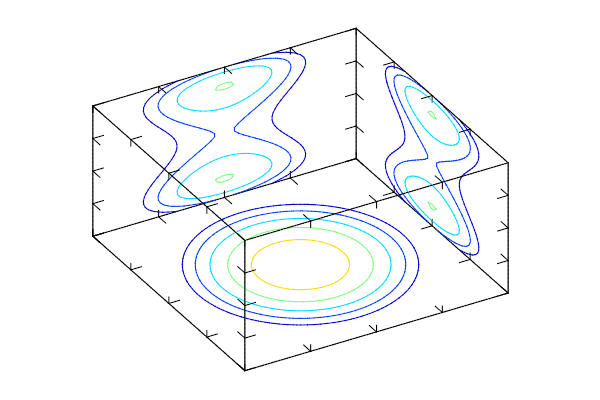
3.3.7 Cont projection sample
new a 60 50 40
modify a '-2*((2*x-1)^2 + (2*y-1)^2 + (2*z-1)^4 - (2*z-1)^2 - 0.1)'
rotate 40 60
box
sum s a 'x'
contx s '' -1
sum s a 'y'
conty s '' 1
sum s a 'z'
contz s '' -1
3.3.8 Dens projection sample
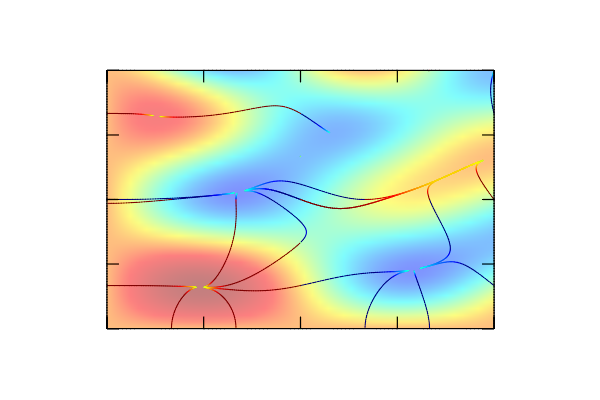
new a 60 50 40
modify a '-2*((2*x-1)^2 + (2*y-1)^2 + (2*z-1)^4 - (2*z-1)^2 - 0.1)'
rotate 40 60
box
sum s a 'x'
densx s '' -1
sum s a 'y'
densy s '' 1
sum s a 'z'
densz s '' -1
3.3.9 CutMinMax sample
new a 60 50 40
modify a '-2*((2*x-1)^2 + (2*y-1)^2 + (2*z-1)^4 - (2*z-1)^2 - 0.1)'
rotate 40 60
light on
alpha on
cut 0 -1 -1 1 0 1
box
surf3 a
3.3.10 “Isocaps” sample
new a 61 51 40
modify a '-2*((2*x-1)^2 + (2*y-1)^2 + (2*z-1)^4 - (2*z-1)^2 - 0.1)'
rotate 40 60
light on
cut 0 -1 -1 1 0 1.1
box
surf3 a -1
contf3 a 'x' -1
contf3 a 'y' -1
contf3 a 'z' 0
contf3 a 'z' 39
3.3.11 CutOff sample
new a 60 50 40
modify a '-2*((2*x-1)^2 + (2*y-1)^2 + (2*z-1)^4 - (2*z-1)^2 - 0.1)'
rotate 40 60
light on
alpha on
cut '(z>(x+0.5*y-1)^2-1) & (z>(x-0.5*y-1)^2-1)'
box
surf3 a
3.4 Dual plotting samples
3.4.1 SurfC sample
new a 50 40
new b 50 40
modify a '0.6*sin(2*pi*x)*sin(3*pi*y) + 0.4*cos(3*pi*(x*y))'
modify b '0.6*cos(2*pi*x)*cos(3*pi*y) + 0.4*cos(3*pi*(x*y))'
rotate 40 60
light on
box
surfc a b
3.4.2 SurfA sample
new a 50 40
new b 50 40
modify a '0.6*sin(2*pi*x)*sin(3*pi*y) + 0.4*cos(3*pi*(x*y))'
modify b '0.6*cos(2*pi*x)*cos(3*pi*y) + 0.4*cos(3*pi*(x*y))'
rotate 40 60
light on
alpha on
box
surfa a b
3.4.3 TileS sample
new a 50 40
new b 50 40
modify a '0.6*sin(2*pi*x)*sin(3*pi*y) + 0.4*cos(3*pi*(x*y))'
modify b '0.6*cos(2*pi*x)*cos(3*pi*y) + 0.4*cos(3*pi*(x*y))'
box
tile a b
3.4.4 Map sample
new a 50 40
new b 50 40
text 0 0 '\to'
zrange -2 2
subplot 2 1 0
text 0 1.1 '\{x, y\}' '' -2
box
fill a 'x'
fill b 'y'
map a b 'brgk' 0 0
subplot 2 1 1
text 0 1.1 '\{\frac{x^3+y^3}{2}, \frac{x-y}{2}\}' '' -2
box
fill a '(x^3+y^3)/2'
fill b '(x-y)/2'
map a b 'brgk' 0 0
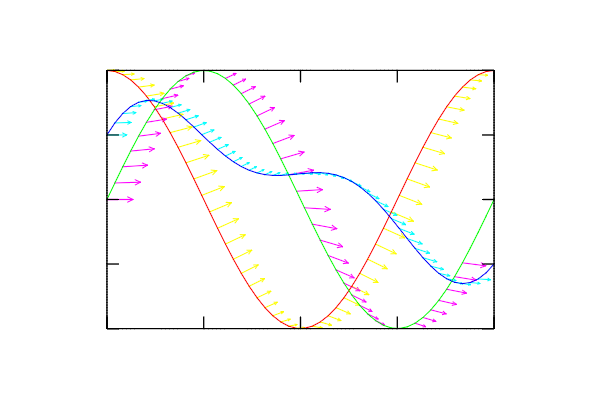
3.4.5 Traj sample
new y 50 3
new x 50
new y1 50
new y2 50
modify y '0.7*sin(2*pi*x) + 0.5*cos(3*pi*x) + 0.2*sin(pi*x)'
modify y 'sin(2*pi*x)' 1
modify y 'cos(2*pi*x)' 2
fill x -1 1
modify y1 '0.5+0.3*cos(2*pi*x)'
modify y2 '0.3*sin(2*pi*x)'
box
plot x y
traj x y y1 y2
3.4.6 Vect sample
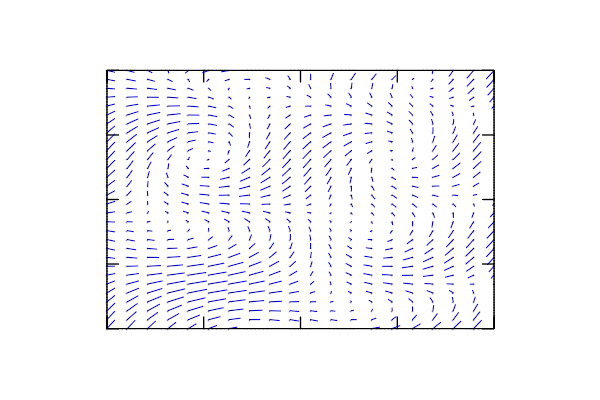
new a 20 30
new b 20 30
modify a '0.6*sin(2*pi*x)*sin(3*pi*y) + 0.4*cos(3*pi*(x*y))'
modify b '0.6*cos(2*pi*x)*cos(3*pi*y) + 0.4*cos(3*pi*(x*y))'
box
vect a b
3.4.7 VectL sample
new a 20 30
new b 20 30
modify a '0.6*sin(2*pi*x)*sin(3*pi*y) + 0.4*cos(3*pi*(x*y))'
modify b '0.6*cos(2*pi*x)*cos(3*pi*y) + 0.4*cos(3*pi*(x*y))'
box
vectl a b
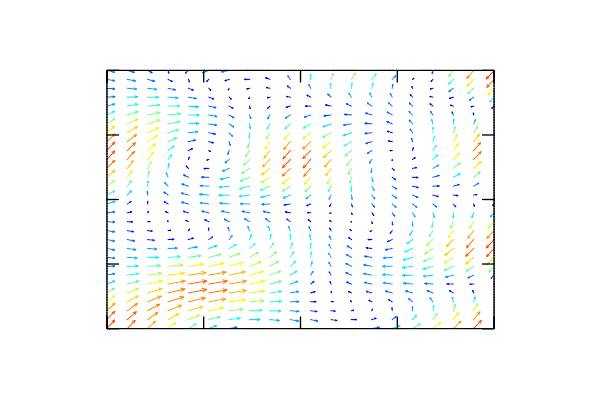
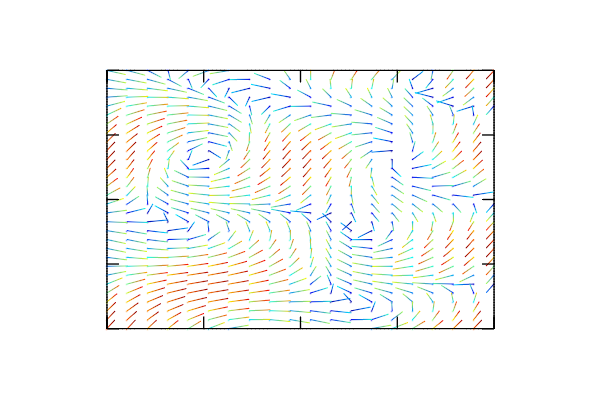
3.4.8 VectC sample
new a 20 30
new b 20 30
modify a '0.6*sin(2*pi*x)*sin(3*pi*y) + 0.4*cos(3*pi*(x*y))'
modify b '0.6*cos(2*pi*x)*cos(3*pi*y) + 0.4*cos(3*pi*(x*y))'
box
vectc a b
3.4.9 Flow sample
new a 20 30
new b 20 30
modify a '0.6*sin(2*pi*x)*sin(3*pi*y) + 0.4*cos(3*pi*(x*y))'
modify b '0.6*cos(2*pi*x)*cos(3*pi*y) + 0.4*cos(3*pi*(x*y))'
box
flow a b
3.4.10 Pipe sample
new a 20 30
new b 20 30
modify a '0.6*sin(2*pi*x)*sin(3*pi*y) + 0.4*cos(3*pi*(x*y))'
modify b '0.6*cos(2*pi*x)*cos(3*pi*y) + 0.4*cos(3*pi*(x*y))'
light on
box
pipe a b
3.4.11 Dew sample
new a 20 30
new b 20 30
modify a '0.6*sin(2*pi*x)*sin(3*pi*y) + 0.4*cos(3*pi*(x*y))'
modify b '0.6*cos(2*pi*x)*cos(3*pi*y) + 0.4*cos(3*pi*(x*y))'
box
light on
dew a b
3.4.12 Surf3C sample
new a 60 50 40
new b 60 50 40
modify a '-2*((2*x-1)^2 + (2*y-1)^2 + (2*z-1)^4 - (2*z-1)^2 - 0.1)'
modify b '1-2*tanh(4*(x+y-1)^2)'
rotate 40 60
light on
alpha on
box
surf3c a b
3.4.13 Surf3A sample
new a 60 50 40
new b 60 50 40
modify a '-2*((2*x-1)^2 + (2*y-1)^2 + (2*z-1)^4 - (2*z-1)^2 - 0.1)'
modify b '1-2*tanh(4*(x+y-1)^2)'
rotate 40 60
light on
alpha on
box
surf3a a b
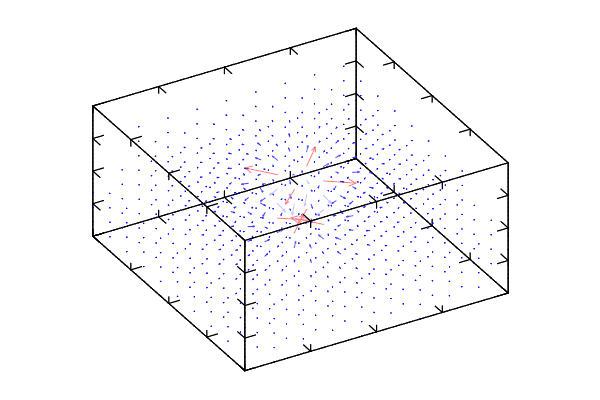
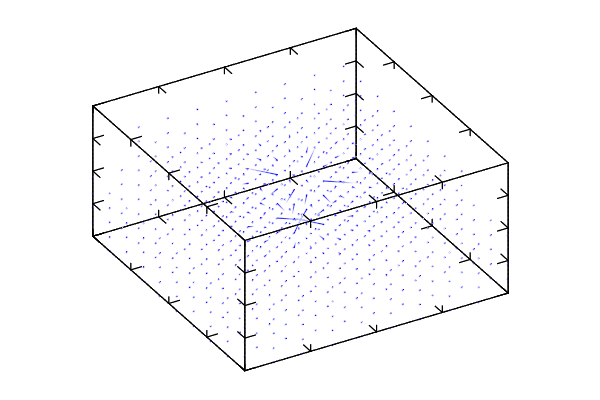
3.4.14 Vect 3D sample
new ex 10 10 10
new ey 10 10 10
new ez 10 10 10
fill ex '0.2*x/pow(x^2+y^2+(z-0.3)^2,1.5) - 0.2*x/pow(x^2+y^2+(z+0.3)^2,1.5)'
fill ey '0.2*y/pow(x^2+y^2+(z-0.3)^2,1.5) - 0.2*y/pow(x^2+y^2+(z+0.3)^2,1.5)'
fill ez '0.2*(z-0.3)/pow(x^2+y^2+(z-0.3)^2,1.5) - 0.2*(z+0.3)/pow(x^2+y^2+(z+0.3)^2,1.5)'
rotate 40 60
box
vect ex ey ez 'bwr'
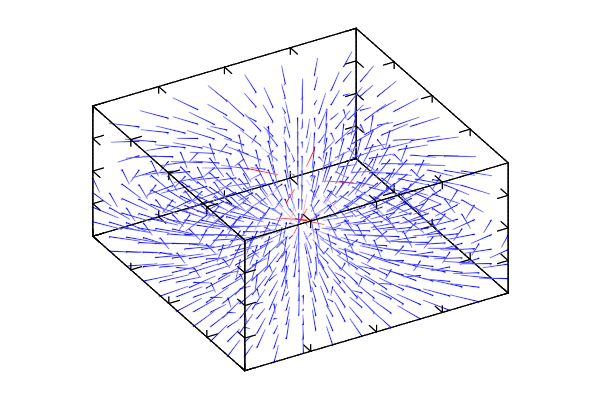
3.4.15 VectL 3D sample
new ex 10 10 10
new ey 10 10 10
new ez 10 10 10
fill ex '0.2*x/pow(x^2+y^2+(z-0.3)^2,1.5) - 0.2*x/pow(x^2+y^2+(z+0.3)^2,1.5)'
fill ey '0.2*y/pow(x^2+y^2+(z-0.3)^2,1.5) - 0.2*y/pow(x^2+y^2+(z+0.3)^2,1.5)'
fill ez '0.2*(z-0.3)/pow(x^2+y^2+(z-0.3)^2,1.5) - 0.2*(z+0.3)/pow(x^2+y^2+(z+0.3)^2,1.5)'
rotate 40 60
box
vectl ex ey ez 'bwr'
3.4.16 VectC 3D sample
new ex 10 10 10
new ey 10 10 10
new ez 10 10 10
fill ex '0.2*x/pow(x^2+y^2+(z-0.3)^2,1.5) - 0.2*x/pow(x^2+y^2+(z+0.3)^2,1.5)'
fill ey '0.2*y/pow(x^2+y^2+(z-0.3)^2,1.5) - 0.2*y/pow(x^2+y^2+(z+0.3)^2,1.5)'
fill ez '0.2*(z-0.3)/pow(x^2+y^2+(z-0.3)^2,1.5) - 0.2*(z+0.3)/pow(x^2+y^2+(z+0.3)^2,1.5)'
rotate 40 60
box
vectc ex ey ez 'bwr'
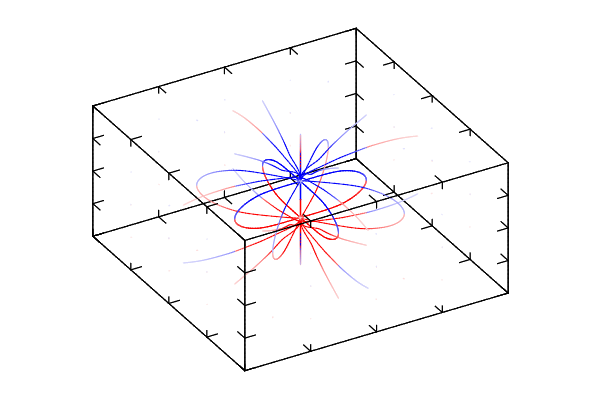
3.4.17 Flow 3D sample
new ex 30 30 30
new ey 30 30 30
new ez 30 30 30
fill ex '0.2*x/pow(x^2+y^2+(z-0.3)^2,1.5) - 0.2*x/pow(x^2+y^2+(z+0.3)^2,1.5)'
fill ey '0.2*y/pow(x^2+y^2+(z-0.3)^2,1.5) - 0.2*y/pow(x^2+y^2+(z+0.3)^2,1.5)'
fill ez '0.2*(z-0.3)/pow(x^2+y^2+(z-0.3)^2,1.5) - 0.2*(z+0.3)/pow(x^2+y^2+(z+0.3)^2,1.5)'
rotate 40 60
box
flow ex ey ez 'bwr'
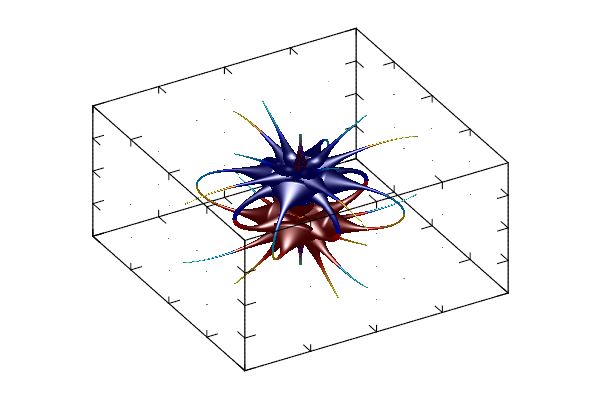
3.4.18 Pipe 3D sample
new ex 10 10 10
new ey 10 10 10
new ez 10 10 10
fill ex '0.2*x/pow(x^2+y^2+(z-0.3)^2,1.5) - 0.2*x/pow(x^2+y^2+(z+0.3)^2,1.5)'
fill ey '0.2*y/pow(x^2+y^2+(z-0.3)^2,1.5) - 0.2*y/pow(x^2+y^2+(z+0.3)^2,1.5)'
fill ez '0.2*(z-0.3)/pow(x^2+y^2+(z-0.3)^2,1.5) - 0.2*(z+0.3)/pow(x^2+y^2+(z+0.3)^2,1.5)'
rotate 40 60
light on
box
pipe ex ey ez 'bwr'
3.4.19 Crust sample
read a 'hotdogs.pts'
norm a -1 1 on
rotate 40 60
light on
box
crust a 'p'
3.4.20 Dots sample
read a 'hotdogs.pts'
norm a -1 1 on
rotate 40 60
box
dots a 'p'
3.5 Basic features
3.5.1 1D plot sample
new y0 50: modify y0 'sin(pi*(2*x-1))'
subplot 2 2 0
plot y0: box

subplot 2 2 1
new y1 50 2
modify y1 'sin(pi*2*x-pi)'
modify y1 'cos(pi*2*x-pi)/2' 1
plot y1: box

new x 50: modify x 'cos(pi*2*x-pi)'
plot x y0 'Y+'
plot y1(:,0) y(:,1) 'q|'

subplot 2 2 2:rotate 60 40
new z 50:   modify z '2*x-1'
plot x y0 z 'g':box
new y2 10 3
modify y2 'cos(pi*(2*x-1-y))'
modify y2 '2*x-1' 2
plot y2(:,0) y2(:,1) y2(:,2) 'bo '

subplot 2 2 3:rotate 60 40
bars x y0 z 'r':box
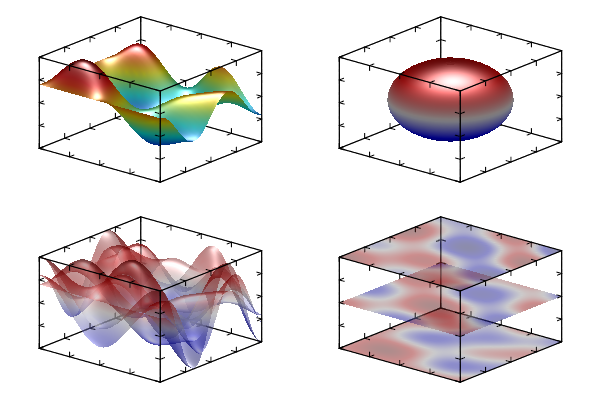
3.5.2 2D plot sample
light on

new a0 50 40
modify a0 '0.6*sin(2*pi*x)*sin(3*pi*y)+0.4*cos(3*pi*(x*y))'
subplot 2 2 0:rotate 60 40
surf a0: box

new x 50 40: new y 50 40: new z 50 40
modify x '0.8*sin(2*pi*x)*sin(pi*y)'
modify y '0.8*cos(2*pi*x)*sin(pi*y)'
modify z '0.8*cos(pi*y)'
subplot 2 2 1:rotate 60 40
surf x y z 'bbwrr': box

new a1 50 40 3
modify a1 '0.6*sin(2*pi*x)*sin(3*pi*y)+0.4*cos(3*pi*(x*y))'
modify a1 '0.6*cos(2*pi*x)*cos(3*pi*y)+0.4*sin(3*pi*(x*y))' 1
modify a1 '0.6*cos(2*pi*x)*cos(3*pi*y)+0.4*cos(3*pi*(x*y))' 2
subplot 2 2 2:rotate 60 40
alpha on
surf a1: box

subplot 2 2 3: rotate 60 40
dens a1: box
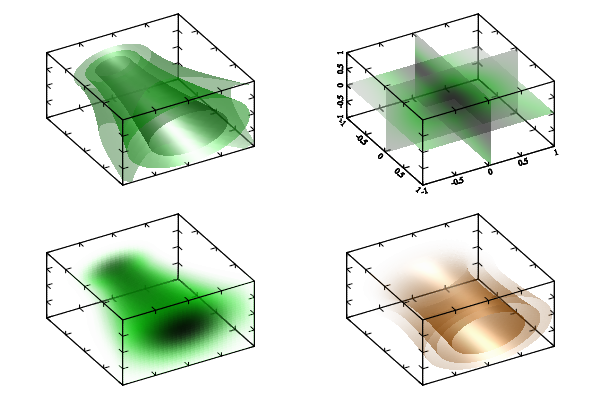
3.5.3 3D plot sample
alpha on: light on
light 0 0 0 1
new a 30 30 30: new b 30 30 30
modify a 'exp(-16*((z-0.5)^2+(y-0.5)^2)/(1+4*x^2))'
modify b '16*((z-0.5)^2+(y-0.5)^2)*(x)/(1+4*x^2)'
caxis 0 1

subplot 2 2 0: rotate 40 60
surf3 a 'wgk': box
subplot 2 2 1: rotate 40 60
densa a: box: axis
subplot 2 2 2: rotate 40 60
cloud a: box
subplot 2 2 3: rotate 40 60
surf3a b a 'q': box
3.5.4 Line styles sample
NOT AVAILABLE
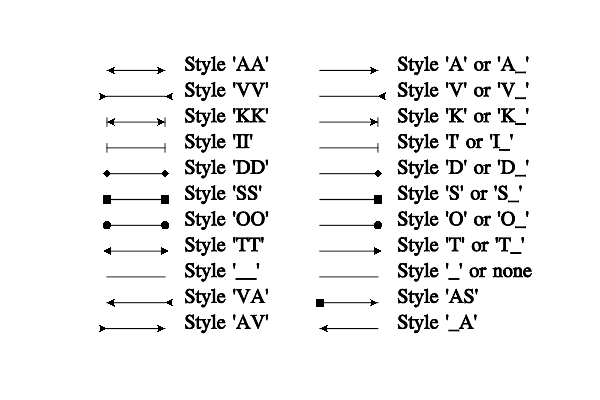
3.5.5 Arrow styles sample
NOT AVAILABLE
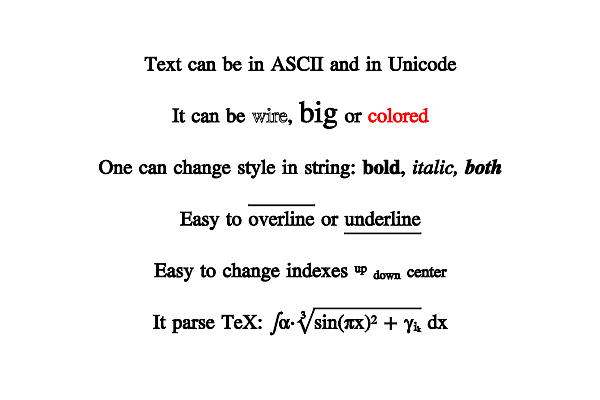
3.5.6 Text styles sample
text 0 1 'Text can be in ASCII and in Unicode'
text 0 0.6 'It can be \wire{wire}, \big{big} or #r{colored}'
text 0 0.2 'One can change style in string: \b{bold}, \i{italic, \b{both}}'
text 0 -0.2 'Easy to \a{overline} or \u{underline}'
text 0 -0.6 'Easy to change indexes ^{up} _{down} @{center}'
text 0 -1 'It parse TeX: \int \alpha \cdot \sqrt3{sin(\pi x)^2 + \gamma_{i_k}} dx'
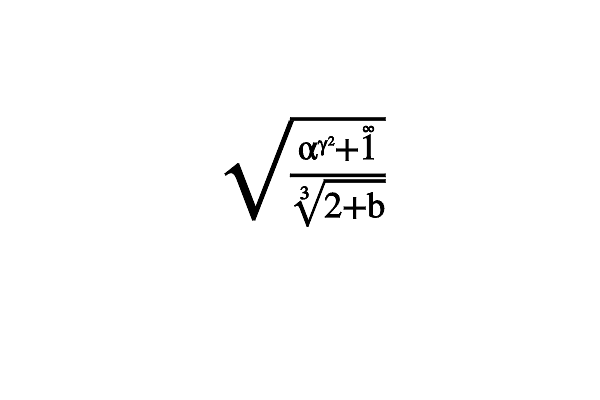
3.5.7 TeX parsing sample
text 0 0 '\sqrt{\frac{\alpha^{\gamma^2}+\overset 1{\big\infty}}{\sqrt3{2+b}}}' '' -4
3.5.8 Font faces sample
NOT AVAILABLE
3.5.9 Colors sample

#LENUQ
facez -1   -1 0 0.4 0.3 'L#': text -0.8 -0.9 'L' 'C:w'
facez -0.6 -1 0 0.4 0.3 'E#': text -0.4 -0.9 'E' 'C:w'
facez -0.2 -1 0 0.4 0.3 'N#': text  0   -0.9 'N' 'C:w'
facez  0.2 -1 0 0.4 0.3 'U#': text  0.4 -0.9 'U' 'C:w'
facez  0.6 -1 0 0.4 0.3 'Q#': text  0.8 -0.9 'Q' 'C:w'
#lenuq
facez -1   -0.7 0 0.4 0.3 'l#': text -0.8 -0.6 'l' 'C:k'
facez -0.6 -0.7 0 0.4 0.3 'e#': text -0.4 -0.6 'e' 'C:k'
facez -0.2 -0.7 0 0.4 0.3 'n#': text  0   -0.6 'n' 'C:k'
facez  0.2 -0.7 0 0.4 0.3 'u#': text  0.4 -0.6 'u' 'C:k'
facez  0.6 -0.7 0 0.4 0.3 'q#': text  0.8 -0.6 'q' 'C:k'
#CMYkP
facez -1   -0.4 0 0.4 0.3 'C#': text -0.8 -0.3 'C' 'C:w'
facez -0.6 -0.4 0 0.4 0.3 'M#': text -0.4 -0.3 'M' 'C:w'
facez -0.2 -0.4 0 0.4 0.3 'Y#': text  0   -0.3 'Y' 'C:w'
facez  0.2 -0.4 0 0.4 0.3 'k#': text  0.4 -0.3 'k' 'C:w'
facez  0.6 -0.4 0 0.4 0.3 'P#': text  0.8 -0.3 'P' 'C:w'
#lenuq
facez -1   -0.1 0 0.4 0.3 'c#': text -0.8 0 'c' 'C:k'
facez -0.6 -0.1 0 0.4 0.3 'm#': text -0.4 0 'm' 'C:k'
facez -0.2 -0.1 0 0.4 0.3 'y#': text  0   0 'y' 'C:k'
facez  0.2 -0.1 0 0.4 0.3 'w#': text  0.4 0 'w' 'C:k'
facez  0.6 -0.1 0 0.4 0.3 'p#': text  0.8 0 'p' 'C:k'
#BGRHW
facez -1   0.2 0 0.4 0.3 'B#': text -0.8 0.3 'B' 'C:k'
facez -0.6 0.2 0 0.4 0.3 'G#': text -0.4 0.3 'G' 'C:k'
facez -0.2 0.2 0 0.4 0.3 'R#': text  0   0.3 'R' 'C:k'
facez  0.2 0.2 0 0.4 0.3 'H#': text  0.4 0.3 'H' 'C:k'
facez  0.6 0.2 0 0.4 0.3 'W#': text  0.8 0.3 'W' 'C:k'
#bgrhw
facez -1   0.5 0 0.4 0.3 'b#': text -0.8 0.6 'b' 'C:w'
facez -0.6 0.5 0 0.4 0.3 'g#': text -0.4 0.6 'g' 'C:w'
facez -0.2 0.5 0 0.4 0.3 'r#': text  0   0.6 'r' 'C:w'
facez  0.2 0.5 0 0.4 0.3 'h#': text  0.4 0.6 'h' 'C:w'
facez  0.6 0.5 0 0.4 0.3 'w#': text  0.8 0.6 'w' 'C:w'
#brighted
facez -1   0.8 0 0.4 0.3 'r1#': text -0.8 0.9 'r1' 'C:k'
facez -0.6 0.8 0 0.4 0.3 'r3#': text -0.4 0.9 'r3' 'C:k'
facez -0.2 0.8 0 0.4 0.3 'r5#': text  0   0.9 'r5' 'C:k'
facez  0.2 0.8 0 0.4 0.3 'r7#': text  0.4 0.9 'r7' 'C:k'
facez  0.6 0.8 0 0.4 0.3 'r9#': text  0.8 0.9 'r9' 'C:k'
3.5.10 Color schemes sample
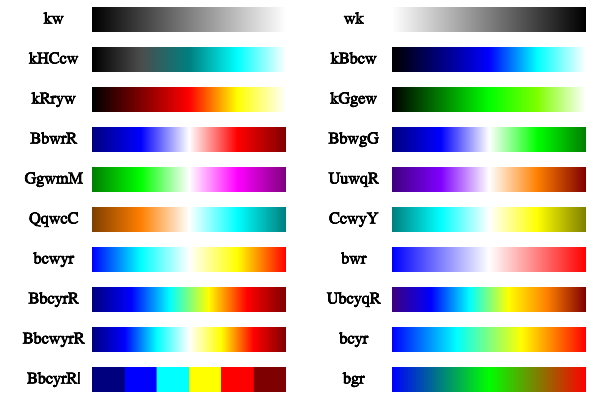
new a 256 2: fill a 'x'
subplot 2 10 0 0.2:dens a 'kw'
text -1.4 -0.3 'kw' '' -8
subplot 2 10 1 0.2:dens a 'wk'
text -1.4 -0.3 'wk' '' -8
subplot 2 10 2 0.2:dens a 'kHCcw'
text -1.4 -0.3 'kHCcw' '' -8
subplot 2 10 3 0.2:dens a 'kBbcw'
text -1.4 -0.3 'kBbcw' '' -8
subplot 2 10 4 0.2:dens a 'kRryw'
text -1.4 -0.3 'kRryw' '' -8
subplot 2 10 5 0.2:dens a 'kGgew'
text -1.4 -0.3 'kGgew' '' -8
subplot 2 10 6 0.2:dens a 'BbwrR'
text -1.4 -0.3 'BbwrR' '' -8
subplot 2 10 7 0.2:dens a 'BbwgG'
text -1.4 -0.3 'BbwgG' '' -8
subplot 2 10 8 0.2:dens a 'GgwmM'
text -1.4 -0.3 'GgwmM' '' -8
subplot 2 10 9 0.2:dens a 'UuwqR'
text -1.4 -0.3 'UuwqR' '' -8
subplot 2 10 10 0.2:dens a 'QqwcC'
text -1.4 -0.3 'QqwcC' '' -8
subplot 2 10 11 0.2:dens a 'CcwyY'
text -1.4 -0.3 'CcwyY' '' -8
subplot 2 10 12 0.2:dens a 'bcwyr'
text -1.4 -0.3 'bcwyr' '' -8
subplot 2 10 13 0.2:dens a 'bwr'
text -1.4 -0.3 'bwr' '' -8
subplot 2 10 14 0.2:dens a 'BbcyrR'
text -1.4 -0.3 'BbcyrR' '' -8
subplot 2 10 15 0.2:dens a 'UbcyqR'
text -1.4 -0.3 'UbcyqR' '' -8
subplot 2 10 16 0.2:dens a 'BbcwyrR'
text -1.4 -0.3 'BbcwyrR' '' -8
subplot 2 10 17 0.2:dens a 'bcyr'
text -1.4 -0.3 'bcyr' '' -8
subplot 2 10 18 0.2:dens a 'BbcyrR|'
text -1.4 -0.3 'BbcyrR|' '' -8
subplot 2 10 19 0.2:dens a 'bgr'
text -1.4 -0.3 'bgr' '' -8
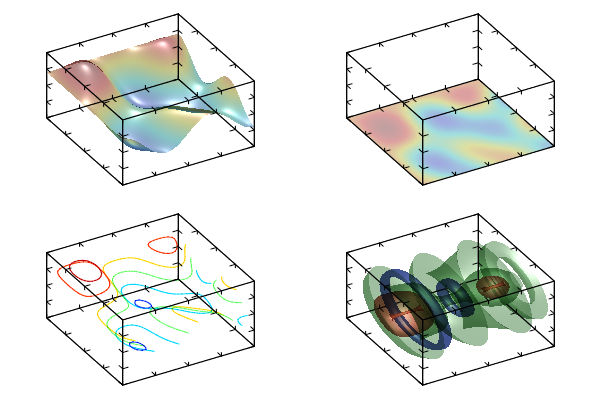
3.5.11 Normal transparency
alpha on: light on
new a 50 40
modify a '0.6*sin(2*pi*x)*sin(3*pi*y) + 0.4*cos(3*pi*(x*y))'

transptype 0: clf
subplot 2 2 0: rotate 40 60: surf a:  box
subplot 2 2 1: rotate 40 60: dens a:  box
subplot 2 2 2: rotate 40 60: cont a:  box
subplot 2 2 3: rotate 40 60: axial a: box
3.5.12 Glass-like transparency
alpha on: light on
new a 50 40
modify a '0.6*sin(2*pi*x)*sin(3*pi*y) + 0.4*cos(3*pi*(x*y))'

transptype 1: clf
subplot 2 2 0: rotate 40 60: surf a:  box
subplot 2 2 1: rotate 40 60: dens a:  box
subplot 2 2 2: rotate 40 60: cont a:  box
subplot 2 2 3: rotate 40 60: axial a: box
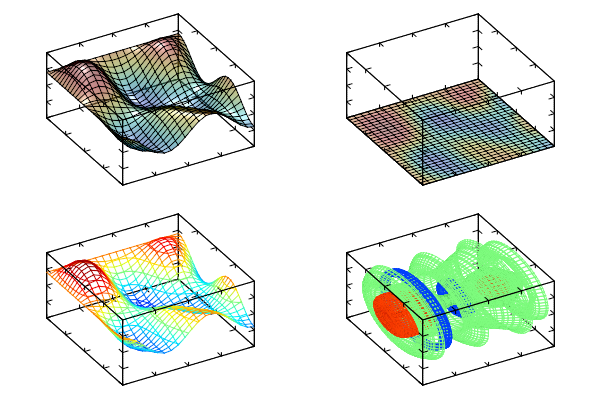
3.5.13 Lamp-like transparency
alpha on: light on
new a 50 40
modify a '0.6*sin(2*pi*x)*sin(3*pi*y) + 0.4*cos(3*pi*(x*y))'

transptype 2: clf
subplot 2 2 0: rotate 40 60: surf a:  box
subplot 2 2 1: rotate 40 60: dens a:  box
subplot 2 2 2: rotate 40 60: cont a:  box
subplot 2 2 3: rotate 40 60: axial a: box
3.6 Additional features
3.6.1 Legend sample
new f 50 3
modify f 'sin(2*pi*x*x)'
modify f 'sin(2*pi*x)' 1
modify f 'sin(2*pi*sqrt(x))' 2
axis 0 -1 1 1
box
plot f
axis
addlegend 'sin(\pi {x^2})' 'b'
addlegend 'sin(\pi x)' 'g*'
addlegend 'sin(\pi \sqrt{\a x})' 'r+'
legend
3.6.2 Adding mesh sample
new a 50 40
modify a '0.6*sin(2*pi*x)*sin(3*pi*y) + 0.4*cos(3*pi*(x*y))'
alpha on
light on
subplot 2 2 0
rotate 40 60
surf a 'BbcyrR#'
box
subplot 2 2 1
rotate 40 60
dens a 'BbcyrR#'
box
subplot 2 2 2
rotate 40 60
cont a 'BbcyrR#'
box
subplot 2 2 3
rotate 40 60
axial a 'BbcyrR#'
box
3.6.3 Surf & Cont sample
new a 50 40
modify a '0.6*sin(2*pi*x)*sin(3*pi*y) + 0.4*cos(3*pi*(x*y))'
rotate 40 60
light on
box
surf a
cont a 'y'
3.6.4 Flow & Dens sample
new a 50 40
new b 50 40
modify a '0.6*sin(2*pi*x)*sin(3*pi*y) + 0.4*cos(3*pi*(x*y))'
modify b '0.6*cos(2*pi*x)*cos(3*pi*y) + 0.4*cos(3*pi*(x*y))'
copy d a
modify d 'sqrt(v^2+w^2)' a b
box
flow a b 'br'
dens d 'BbcyrR'
3.6.5 Several light sample
new a 50 40
modify a '0.6*sin(2*pi*x)*sin(3*pi*y) + 0.4*cos(3*pi*(x*y))'
rotate 40 60
light on
light 1 0 1 0 'c'
light 2 1 0 0 'y'
light 3 0 -1 0 'm'
box
surf a 'h'
3.6.6 Mirrored surface sample
new a 30 40
modify a 'pi*(1-2*x)*exp(-4*y^2-4*(2*x-1)^2)'
rotate 40 60
light on
surf a 'r'; yrange 0 1
surf a 'b'; yrange 0 -1
box
or
new a 30 40
var x 30 -1 1
var y1 40 0 1
var y2 40 0 -1
modify a 'pi*(1-2*x)*exp(-4*y^2-4*(2*x-1)^2)'
rotate 40 60
light on
surf x y1 a 'r'
surf x y2 a 'b'
box
3.6.7 Cont with labels sample
new a 50 40
modify a '0.6*sin(2*pi*x)*sin(3*pi*y) + 0.4*cos(3*pi*(x*y))'
box
cont a 'BbcyrRt'
3.6.8 Ternary plot sample
new rx 10
new ry 10
new x 50
new y 50
new a 20 30
modify a '4*x*y'
modify x '0.25*(1+cos(2*pi*x))'
modify y '0.25*(1+sin(2*pi*x))'
modify rx 'rnd'
modify ry 'rnd*(1-v)' rx
text -0.8 1.3 'Ternary plot (x+y+t=1)'
ternary 1
plot x y 'r2'
plot rx ry 'q^ '
cont a
line 0.5 0 0 0.75 'g2'
axis
grid 'xyz' 'B;'
xlabel 'x comp.'
ylabel 'y comp.'
tlabel 't comp.'
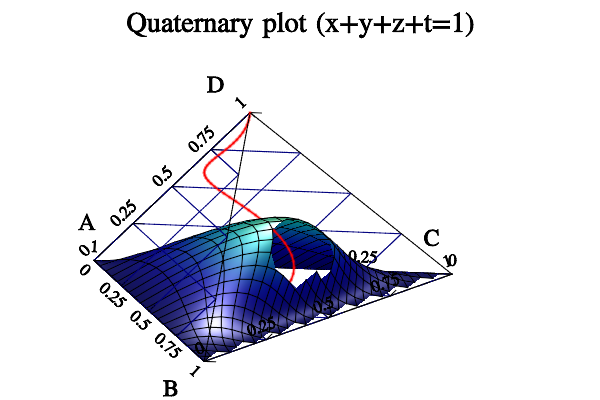
3.6.9 Quaternary plot sample
new x 50:new y 50:new z 50:new a 20 30
modify a 'x*y*(1-x-y)^2*30'
modify x '0.25*(1-x)*(1+cos(2*pi*x))'
modify y '0.25*(1-x)*(1+sin(2*pi*x))'

text 0 1.3 'Quaternary plot (x+y+z+t=1)'
rotate 60 70:light on
ternary 2:cut on
plot x y z 'r2':surf a '#'
axis:box:grid
rotatetext off
tlabel 'A' 1:xlabel 'B' 1
ylabel 'C' 1:zlabel 'D' 1
3.6.10 Coloring by coordinates sample
new a 60 50 40
modify a '-2*((2*x-1)^2 + (2*y-1)^2 + (2*z-1)^4 - (2*z-1)^2 - 0.1)'
rotate 40 60
box
surf3 a 'bgrd'
3.6.11 Drops sample
light on
text -1 1.2 'sh=0'
drop -1 0 0 1 0.5 'r' 0
text -0.33 1.2 'sh=0.33'
drop -0.33 0 0 1 0.5 'r' 0.33
text 0.33 1.2 'sh=0.67'
drop 0.33 0 0 1 0.5 'r' 0.67
text 1 1.2 'sh=1'
drop 1 0 0 1 0.5 'r' 1
ball -1 0 1 'k'
ball -0.33 0 1 'k'
ball 0.33 0 1 'k'
ball 1 0 1 'k'
line -1 0 1 1 0 1 'b'
new h 100
modify h '0.25*(1+x)^2'
plot h 'k|'
text -1 0.6 'h\sim(1+sh)^2' 'rL'
3.6.12 Molecules drawing sample
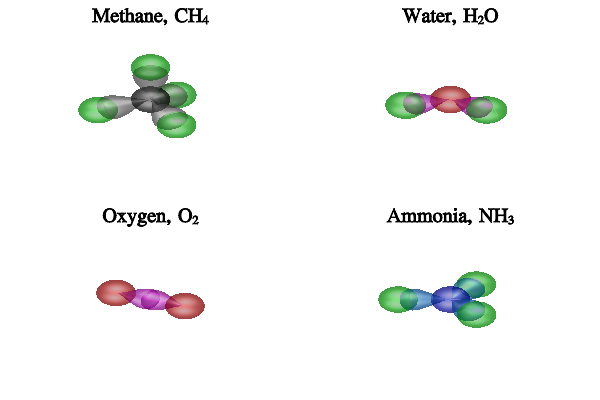
alpha on
light on
subplot 2 2 0
text 0 1.2 'Methane, CH_4' '' -3
rotate 60 120
sphere 0 0 0 0.25 'k'
drop 0 0 0 0 0 1 0.35 'h' 1 2
sphere 0 0 0.7 0.25 'g'
drop 0 0 0 -0.94 0 -0.33 0.35 'h' 1 2
sphere -0.66 0 -0.23 0.25 'g'
drop 0 0 0 0.47 0.82 -0.33 0.35 'h' 1 2
sphere 0.33 0.57 -0.23 0.25 'g'
drop 0 0 0 0.47 -0.82 -0.33 0.35 'h' 1 2
sphere 0.33 -0.57 -0.23 0.25 'g'
subplot 2 2 1
text 0 1.2 'Water, H{_2}O' '' -3
rotate 60 100
sphere 0 0 0 0.25 'r'
drop 0 0 0 0.3 0.5 0 0.3 'm' 1 2
sphere 0.3 0.5 0 0.25 'g'
drop 0 0 0 0.3 -0.5 0 0.3 'm' 1 2
sphere 0.3 -0.5 0 0.25 'g'
subplot 2 2 2
text 0 1.2 'Oxygen, O_2' '' -3
rotate 60 120
drop 0 0.5 0 0 -0.3 0 0.3 'm' 1 2
sphere 0 0.5 0 0.25 'r'
drop 0 -0.5 0 0 0.3 0 0.3 'm' 1 2
sphere 0 -0.5 0 0.25 'r'
subplot 2 2 3
text 0 1.2 0 'Ammonia, NH_3' '' -3
rotate 60 120
sphere 0 0 0 0.25 'b'
drop 0 0 0 0.33 0.57 0 0.32 'n' 1 2
sphere 0.33 0.57 0 0.25 'g'
drop 0 0 0 0.33 -0.57 0 0.32 'n' 1 2
sphere 0.33 -0.57 0 0.25 'g'
drop 0 0 0 -0.65 0 0 0.32 'n' 1 2
sphere -0.65 0 0 0.25 'g'
3.7 Advanced features
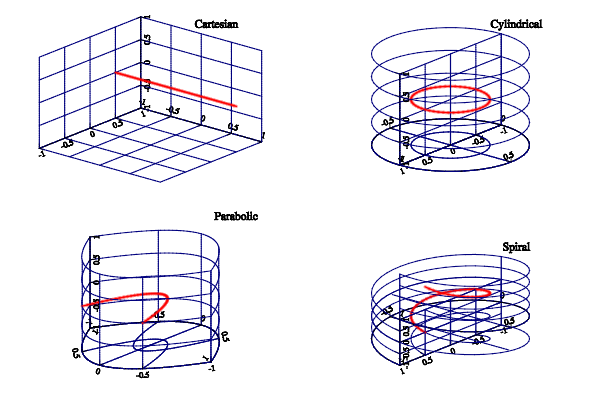
3.7.1 Curvelinear coorinates sample
origin -1 1 -1
subplot 2 2 0
rotate 60 40
line -1 0.5 0 1 0.5 0 'r2'
axis
grid
text 0 1.3 1 'Cartesian'
subplot 2 2 1
rotate 60 40
axis 'y*sin(pi*x)' 'y*cos(pi*x)' ''
line -1 0.5 0 1 0.5 0 'r2'
axis
grid
text 0 1.3 1 'Cylindrical'
subplot 2 2 2
rotate 60 40
axis '2*y*x' 'y*y - x*x' ''
line -1 0.5 0 1 0.5 0 'r2'
axis
grid
text 0 1.3 1 'Parabolic'
subplot 2 2 3
rotate 60 40
axis 'y*sin(pi*x)' 'y*cos(pi*x)' 'x+z'
line -1 0.5 0 1 0.5 0 'r2'
axis
grid
text 0 1.3 1 'Spiral'
axis '' '' '' # set to default Cartesian
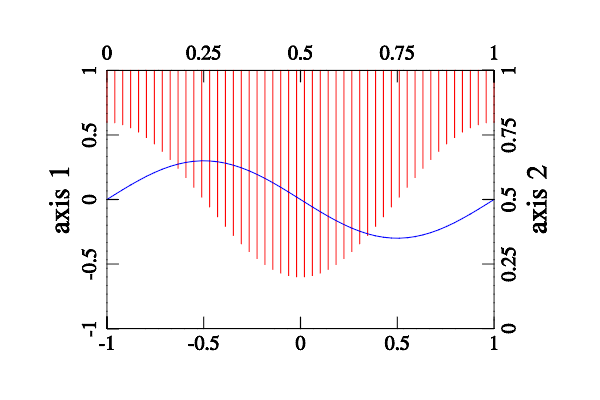
3.7.2 2-axes sample
new y1 50
new y2 50
modify y1 '0.3*sin(2*pi*x)'
modify y2 '0.5+0.3*cos(2*pi*x)'
axis -1 -1 -1 1 1 1
origin -1 -1 -1
axis
ylabel 'axis 1' 0
plot y1 'b'
axis 0 0 0 1 1 1
origin 1 1 1
axis
ylabel 'axis 2' 0
stem y2 'r'
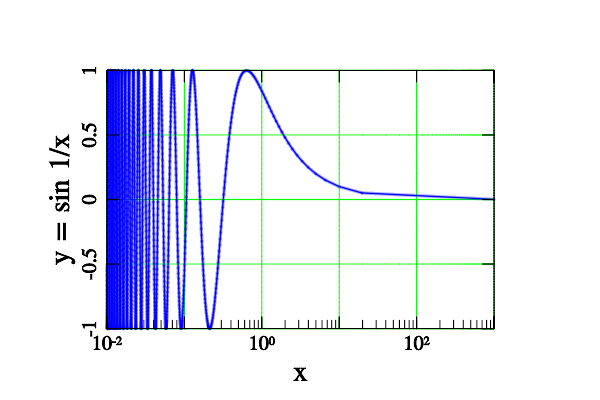
3.7.3 Semi-log sample
new x 2000
new y 2000
modify x '0.01/(x+10^(-5))'
modify y 'sin(1/v)' x
xrange 0.01 1000
origin 0.01 -1 0
xtick 0
axis 'lg(x)' '' ''
plot x y 'b2'
axis
grid 'xy' 'g'
xlabel 'x' 0
ylabel 'y = sin 1/x' 0
box
3.7.4 Log-log sample
new x 100
new y 100
modify x 'pow(10,6*x-3)'
modify y 'sqrt(1+v^2)' x
axis 0.001 0.1 1000 1000
xtick 0
ytick 0
axis 'lg(x)' 'lg(y)' ''
plot x y 'b2'
axis
grid 'xy' 'g;'
xlabel 'x' 0
ylabel 'y=\sqrt{1+x^2}' 0
box
3.7.5 Fitting sample
new rnd 100
fill rnd '0.4*rnd+0.1+sin(2*pi*x)'
new in 100
fill in '0.3+sin(2*pi*x)'
yrange -2 2
plot rnd '. '
box
list ini 1 1 3
fit res rnd 'a+b*sin(c*x)' 'abc' ini
plot res 'r'
plot in 'b'
text -1 -1.3 'fitted:' 'L:r' -1
putsfit 0 -1.8 'y = ' 'C:r'
text 0 2.2 'initial: y = 0.3+sin(2\pi x)' 'C:b' -1
3.7.6 Envelop sample
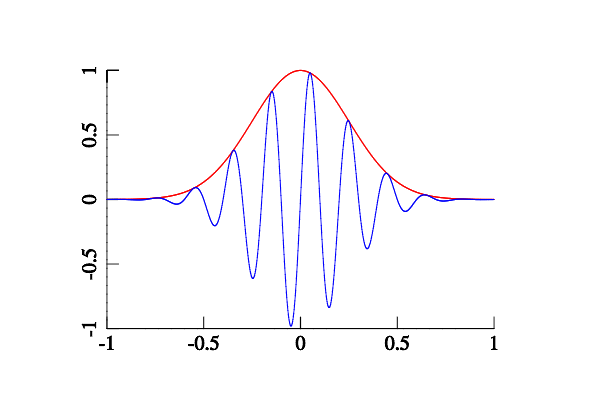
new a 1000
fill a 'exp(-8*x^2)*sin(10*pi*x)'
plot a 'b'
envelop a
plot a 'r'
axis
3.7.7 Sew sample
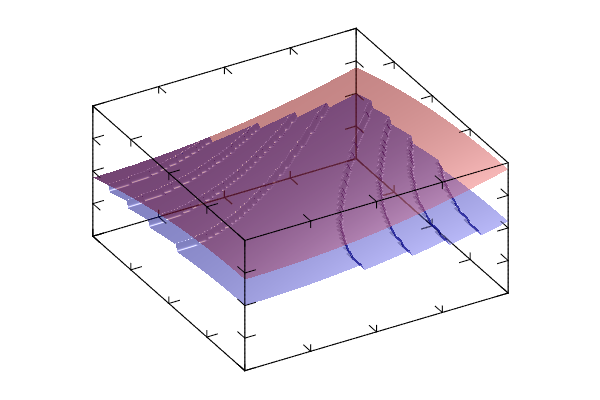
new a 100 100
modify a 'mod((y^2-(1-x)^2)/2,0.1)'
rotate 40 60
light on
alpha on
surf a 'b'
sew a 'xy' 0.1
surf a 'r'
box
3.7.8 STFA sample
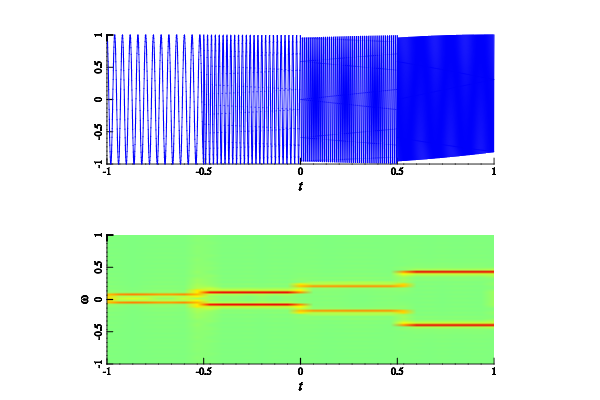
new a 2000
new b 2000
fill a 'cos(50*pi*x)*(x<-.5)+cos(100*pi*x)*(x<0)*(x>-.5)+
        cos(200*pi*x)*(x<.5)*(x>0)+cos(400*pi*x)*(x>.5)'
subplot 1 2 0
plot a
axis
xlabel '\i t'
subplot 1 2 1
stfa a b 64 ''
axis
ylabel '\omega' 0
xlabel '\i t'
3.7.9 PDE sample
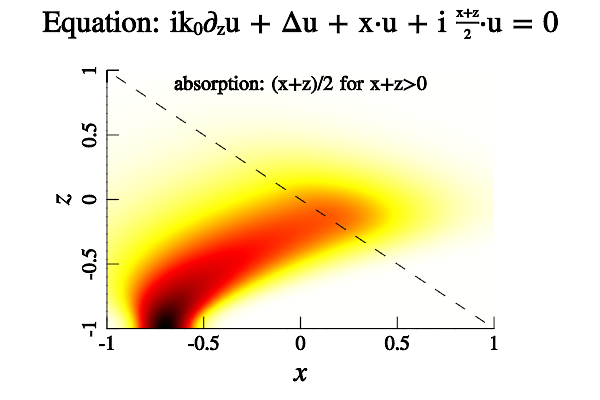
axis
xlabel '\i x'
ylabel '\i z'
new re 128
new im 128
fill re 'exp(-48*(x+0.7)^2)'
pde a 'p^2+q^2-x-1+i*0.5*(z+x)*(z>-x)' re im 0.01 30
transpose a
crange 0 1
dens a 'wyrRk'
fplot '-x' 'k|'
text 0 0.85 'absorption: (x+z)/2 for x+z>0' '' -1
title 'Equation: ik_0\partial_zu + \Delta u + x\cdot u + i \frac{x+z}{2}\cdot u = 0' 'iC' -1.5
3.7.10 Beam tracing sample
define $1 'p^2+q^2-x-1+i*0.5*(y+x)*(y>-x)'
ray r $1 -0.7 -1 0 0 0.5 0 0.02 2
plot r(0) r(1) 'k'
axis
xlabel '\i x'
ylabel '\i z'
new re 128
new im 128
new xx
new yy
fill re 'exp(-48*x^2)'
qo2d a $1 re im r 1 30 xx yy
crange 0 1
dens xx yy a 'wyrRk'
fplot '-x' 'k|'
text -0.8 0.85 'absorption: (x+y)/2 for x+y>0' 'L' -1
text 0.5 -0.05 'central ray' 'L' -1
title 'Beam and ray tracing' 'C' -1.5
3.7.11 Parser sample
3.7.12 Tick values sample
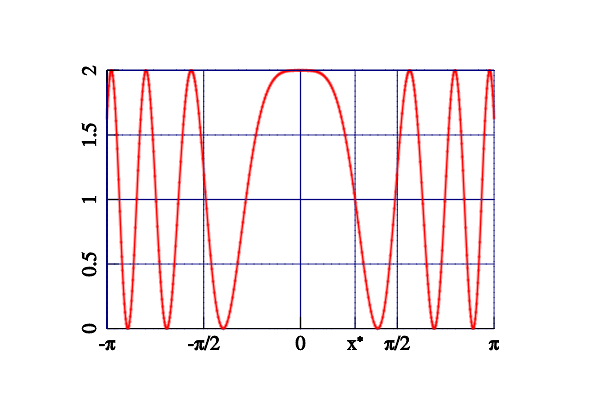
axis -pi 0 pi 2
xtick -pi '-\pi' -1.571 '-\pi/2' 0 '0' 0.886 'x^*' 1.571 '\pi/2' pi '\pi'
axis
grid
fplot '2*cos(x^2)^2' 'r2' nan 300
3.7.13 ColumnPlot sample
for $1 0 3
columnplot 4 $1
box
text -0.5 0.5 'Plot $1 of 4'
fplot 'sin(pi*x+pi*$1/2)'
next
3.7.14 StickPlot sample
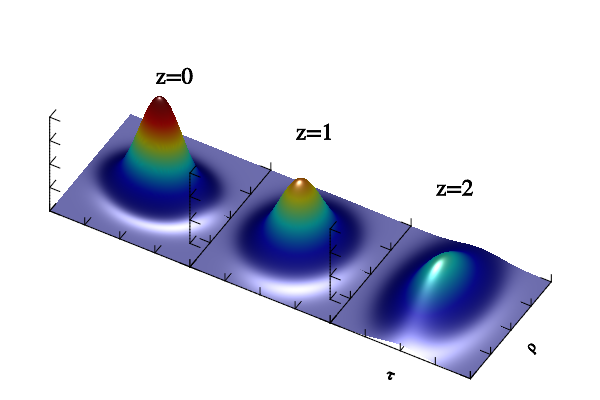
ranges -1 1 -1 1 0 1:light on
stickplot 3 0 40 30 : axis 'xyz_'
fsurf 'exp(-10*y^2-6*x^2)'
text 0.2 0 1.2 'z=0' '' -2
stickplot 3 1 40 30 : axis 'xy_'
fsurf 'exp(-10*y^2/2-6*x^2)/sqrt(2)'
text 0.2 0 1.2 'z=1' '' -2
stickplot 3 2 40 30 : axis 'xy_'
fsurf 'exp(-10*y^2/5-6*x^2)/sqrt(5)'
text 0.2 0 1.2 'z=2' '' -2
xlabel '\tau' 0 : ylabel '\rho'
3.7.15 Stereo image sample
new a 50 40
modify a '0.6*sin(2*pi*x)*sin(3*pi*y) + 0.4*cos(3*pi*(x*y))'
light on
subplot 2 1 0
rotate 40 60+3
box:surf a
subplot 2 1 1
rotate 40 60-3
box:surf a
This document was generated by Alexey Balakin on May 31, 2011 using texi2html 1.82.


